Planet OpenNMS

March 13, 2024

March 2024 Releases – Horizon 33.0.2, 2023.1.14, 2022.1.26, 2021.1.37

In March, we released updates to all OpenNMS Meridian versions under active support, as well as Horizon 33.0.2.

Meridian Stable Updates

Meridians 2023.1.14, 2022.1.26, 2021.1.37 contains a bunch of bug fixes and enhancements.

For a list of changes, see the release notes:

Horizon 33.0.2

Release 33.0.2 contains a bunch of bug fixes and enhancements.

For a high-level overview of what has changed in Horizon 33, see What’s New in OpenNMS Horizon 33.

For a complete list of changes, see the changelog.

The codename for Horizon 33.0.2 is Old Man's Beard.

The post March 2024 Releases – Horizon 33.0.2, 2023.1.14, 2022.1.26, 2021.1.37 appeared first on The OpenNMS Group, Inc..

by Morteza Ershad-Manesh at March 13, 2024 03:37 PM

OpenNMS Horizon 33.0.2 (Old Man’s Beard)

Release 33.0.2

Release 33.0.2 contains a bunch of bug fixes and enhancements.

The codename for Horizon 33.0.2 is Old Man’s Beard.

Bug
  • Access Denied when deleting a node with admin user (Issue NMS-15746)
  • Device config upload failed with org.apache.sshd.common.SshException: EdDSA provider not supported (Issue NMS-16131)
  • Event parameters with <> not rendering in event/alarm views (Issue NMS-16157)
  • Hikari CP leaking threads (Issue NMS-16345)
  • LdapMonitor does not work when a Minion is the poller (Issue NMS-16349)
  • The script showing the Karaf process status in our container image requires "ps" (Issue NMS-16356)
  • VMware credentials exposed in provisiond log file (Issue NMS-16357)
  • Collectd can’t persist time series data and throwing a NPE with "java.util.List.size()" because "rraList" is null (Issue NMS-16358)
Enhancement
  • Update install script to clear Karaf cache (Issue NMS-16226)
  • Add option to import-requisition command to block until import is done (Issue NMS-16343)
  • Rename User Data Collection feature to Product Update Enrollment (Issue NMS-16353)
  • Configurable option for Kafka Producer CollectionSet buffer size (Issue NMS-16366)

by mershad-manesh at March 13, 2024 03:30 PM

Enterprise Network Monitoring with Flow Data

OpenNMS Meridian is a powerful enterprise network monitoring solution, thanks in part to its flexibility and ability to connect to and monitor a wide range of network devices through network flow data. By providing comprehensive insights into device status, traffic patterns and performance metrics, Meridian empowers your organization to make data-driven decisions.

The platform’s ability to conduct detailed health checks on network devices and generate customized alerts ensures prompt issue resolution and minimal downtime. And its advanced analytics capabilities enable anomaly detection, safeguarding networks against security threats like DDoS attacks.

This blog digs into the concepts of network flow data and how OpenNMS Meridian ingests and integrates it to deliver a robust network monitoring solution.

OpenNMS Meridian is not just a monitoring tool, but a strategic asset for enterprise, ensuring networks are not only healthy and secure but also well-prepared for future growth and challenges.

What is Network Flow Data?

Network flow data is a way to collect the meta information of a packet entering or leaving a network device. OpenNMS can leverage that metadata with the help of analytics to provide insight on sources, destinations, types of traffic, and the quality of service.

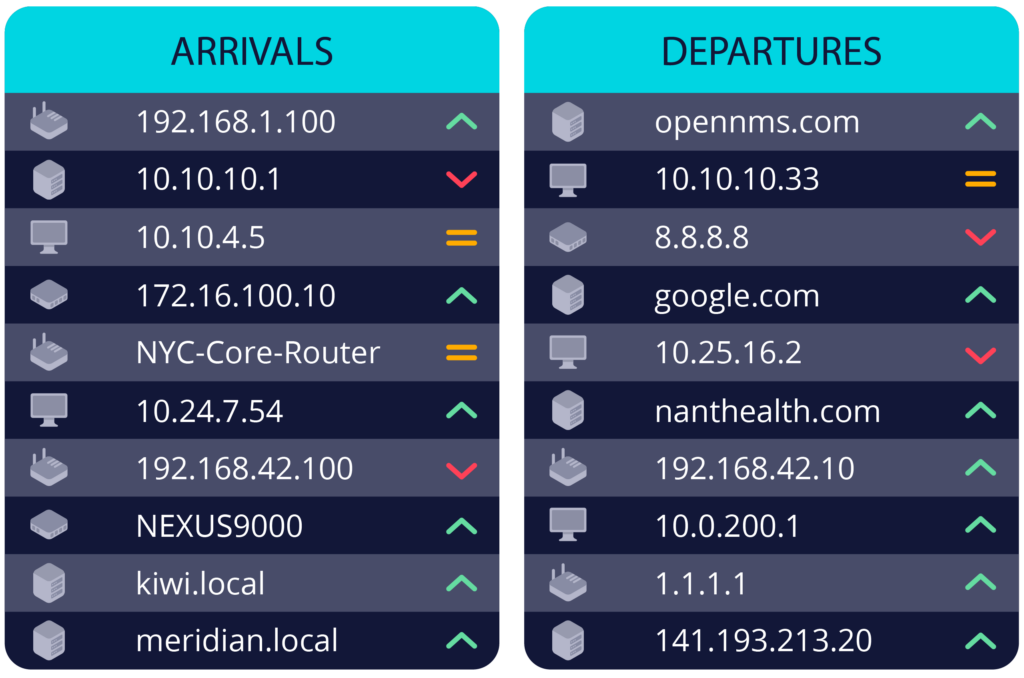
You can think of flow data like airport departure and arrival logs. Consider a network as an airport where data packets are like departing and arriving flights. Flows can be likened to the departure and arrival logs that track various details of each flight, such as the airline flight number, departure, city arrival, city passenger count, and flight duration.

alt

What Problems Does Monitoring Network Flow Data Help Solve?

Network engineers face many challenges. It can be difficult to diagnose performance issues, especially in real-time, as users encounter them. A network engineer must look at many aspects of the potential issue. Is this an application issue, or is it the user's device, or could it actually be something on the network?

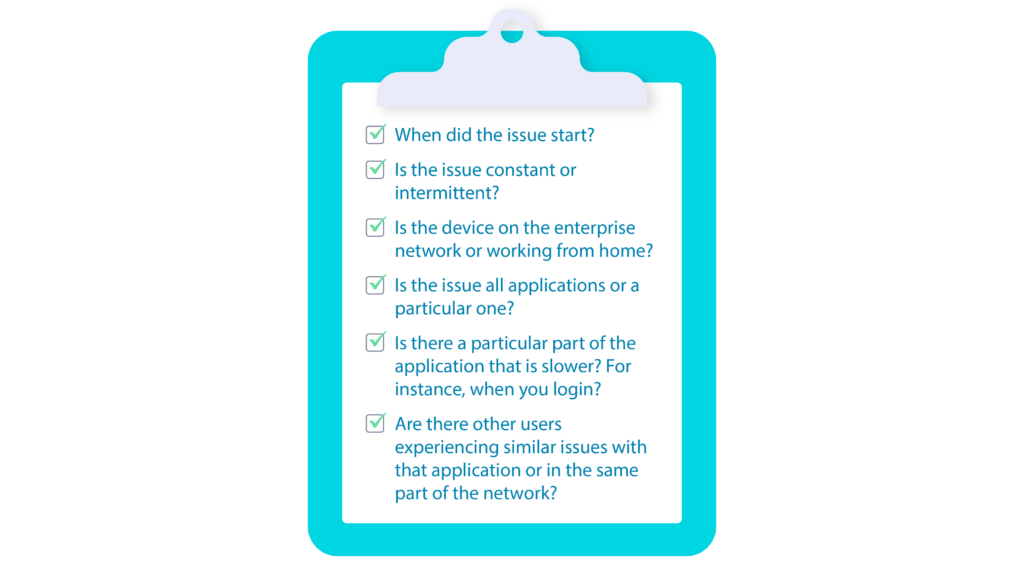
Even when it has been determined to be an issue with the network, an admin will typically go through a list of questions before they can even begin the troubleshooting process:

  • When did the issue start?
  • Is the issue constant or intermittent?
  • Is the device on the enterprise network or someone's home network?
  • Is the issue related to all applications or just a particular one?
  • Is there a particular part of the application that is slower, or are there other users experiencing similar issues with that application?
alt

Where Do Data Flows Come From?

flow data

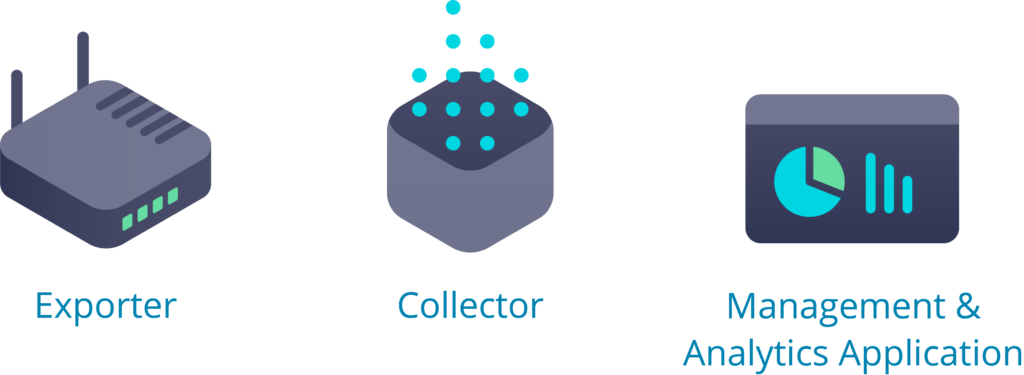
Network elements for data flows consist of exporters, devices like routers, switches, and firewalls; collectors, in our case OpenNMS Meridian; and management and analytics applications, also OpenNMS Meridian. It's useful to understand that while flows are often exported from networking equipment like routers and switches, flow data can also come directly from servers, and they can export telemetry data through the sFlow protocol.

OpenNMS is a collector for data flows. It leverages something called telemetryd or the telemetry daemon to ingest flow information from exporters. The telemetry daemon provides a framework to handle sensor data pushed to Meridian. The framework supports applications that use different protocols to transfer metrics. By default, we use a single port listener, which works for many flow protocols like jFlow, sFlow, and several versions of NetFlow, including IPFIX. With telemetryd, operators can define listeners supporting different protocols to receive the telemetry data and adapters transferring the received data into generic formats like flows or performance data.

How Does OpenNMS Manage, Enrich, and Classify Flow Data?

OpenNMS stores flow records into Elasticsearch using an OpenNMS-created plugin that installs into your Elasticsearch cluster. You can set up persistence policy for Elasticsearch to only keep flow records for a specific period of time. OpenNMS enriches flow records by using information it already has about systems and its inventory. It tags data flows and groups them based on rules. OpenNMS can leverage node data and the metadata associated with nodes like categories to enrich flow records. This enrichment adds context to speed time to resolution when troubleshooting and can enhance forensic network analysis.

OpenNMS uses a classification engine that applies rules to filter and classify flows. The flow classification engine bundled with Meridian is adapted from IANA standards and includes a predefined set of rules that define more than 6,200 applications for basic communication protocols. You can classify flows by a combination of parameters, including source and destination, port source and destination address IP protocol, and exporter.

Conversations can be identified based on classified flow traffic between a set of hosts, information about quality of service provided by DSCP (Differentiated Services Code Point), and OpenNMS can enrich information about the specific host involved in a flow. Classifications help you determine how flows are associated with a particular appliance service or other component and how they affect your network.

For example, Bitcoin traffic on Port A 333 or all flows to Port AD marked as HTTP. Meridian allows for customized rules to classify flows. A rule includes a name for the classification or application and additional parameters such as source and destination ports and addresses that must match.

See Real OpenNMS Meridian Demos

Watch the webinar with Marshall Massengill, Principal Solutions Delivery Architect, OpenNMS. See demos of data flows discussed in this blog:

  • Visualizing Flow Data with OpenNMS Meridian
  • Configuring Devices to Export Flows: Cisco, Juniper, pfSense, and VMware vSphere Distributed Switch (VDS) 

  • Visualizing Flows with OpenNMS and Grafana

  • Flow Data Thresholding: leverage flow data to monitor your network for performance and anomalies

flow data

“OpenNMS can scale to your network size needs. Some of our customers ingest and enrich over 350,000 flows per second.”

Collecting and Enriching Large Amounts of Flow Data

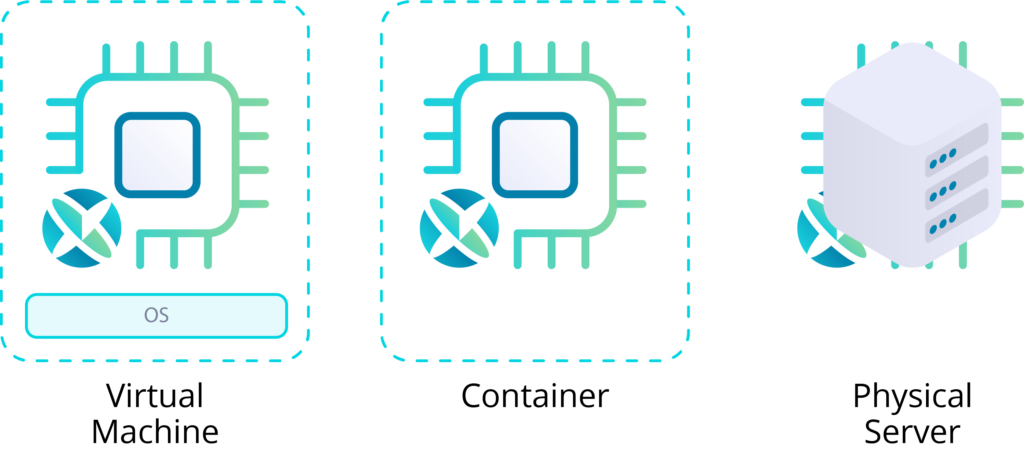
OpenNMS overcomes the challenge of collecting large amounts of flow data by distributing collection across Minions. Minions are a lightweight stateless service used to add capacity and reduce the load on Meridian core. By enabling horizontal scaling of collection, minions can be deployed as virtual machines, containers, hardware appliances, or physical servers.

alt

Meridian overcomes the challenges of enriching large amounts of flow data by distributing processing workload through sentinels. Sentinels are purpose-built modules that allow Meridian to scale flow enrichment horizontally by transparently offloading work and placing enriched flow records directly into Elasticsearch. Sentinels can be installed on containers, virtual machines, or physical hardware and have requirements similar to Meridian.

OpenNMS can scale to your network size needs. Some of our customers ingest and enrich over 350,000 flows per second.

flow data

Conclusion

In summary, Meridian can ingest many types of flow and telemetry data. With the analytics Meridian provides for sources, destinations, types of traffic, and the quality of service, it's possible to gain holistic insight into your network. Using the powerful Meridian flow enrichment capabilities, you can quickly pinpoint the sources of networking issues and reduce time to resolution. OpenNMs Meridian can be deployed on a single host and can scale with your needs by using Minions and sentinels to enable collecting and enriching large amounts of data.

If you have a complex or demanding use case for flows, then get in touch. We're here to help.

The post Enterprise Network Monitoring with Flow Data appeared first on The OpenNMS Group, Inc..

by Marshall Massengill at March 13, 2024 02:17 PM

March 06, 2024

Network Monitoring Solutions: Your Complete Guide

In today's hyper-connected world, where billions of users interact with websites, applications, and services every second, network monitoring solutions are critical to ensuring your network operations stay consistent and reliable. When deployed effectively, they provide continuous surveillance of your network traffic, performance, and security, allowing your team to proactively identify potential trouble spots and address issues, from slow loading times to security threats, before they disrupt services.

With the right network monitoring solution in place, you can not only enhance the performance and security of your networks but also deliver a reliable and seamless internet experience for your users.

network monitoring solutions

What are Network Monitoring Solutions?

Network monitoring solutions give administrators real-time visibility into network activity, enabling them to detect and respond to anomalies promptly. By monitoring for unusual patterns or suspicious activity, network monitoring solutions can help prevent cyber-attacks such as malware infections, DDoS attacks, and data breaches, which can cripple an organization's online presence and reputation.

Network monitoring solutions can also help you optimize network performance by targeting and mitigating bottlenecks and congestion points. Network administrators can ensure that resources are allocated efficiently, preventing slowdowns and traffic blockages that can impede user experience.

“Distributed environments require a network monitoring solution that is deployable in a dispersed configuration to reach into systems and networks that would otherwise be inaccessible while keeping the monitoring logic centralized for easier operation and administration.

network monitoring solutions FAQ

Network Monitoring FAQ

  • Why is network monitoring important?

    Network monitoring is important because it helps ensure the smooth operation of networks by identifying and mitigating issues before they escalate. It also helps optimize network performance, detect security threats, and ensure compliance with regulatory requirements.

  • How does a network monitoring solution work?

    A network monitoring solution works by collecting data from network devices and traffic, analyzing this data to identify issues and trends, and presenting the findings to administrators through reports, alerts, and visualizations.

  • What are the benefits of using a network monitoring solution?

    The benefits of using a network monitoring solution include improved network performance and reliability, enhanced security, reduced downtime, and increased operational efficiency.

  • How do network monitoring solutions help with troubleshooting?

    Network monitoring solutions help troubleshoot by providing real-time visibility into network performance and security, allowing administrators to quickly identify and resolve issues.

  • How can I choose the right network monitoring solution for my organization?

    When choosing a network monitoring solution, consider the scale and complexity of your network, your budget, the features, ease of use and integration capabilities of the solution, and the level of support the vendor provides. It's also a good idea to try out a few different solutions before deciding.

network monitoring solutions features

Network Monitoring Solutions Features

Network monitoring solutions should include various features to empower network administrators to monitor and maintain their networks more efficiently.

Network Traffic Monitoring: Track the flow of data within a network, capturing information about the volume, sources, and destinations of traffic. This helps identify normal behavior patterns and anomalies that may indicate network issues or security threats. Administrators can detect and resolve issues such as bandwidth congestion, network bottlenecks, and unauthorized access attempts.

Performance Monitoring: Performance monitoring involves tracking the performance of network devices, servers, and applications to confirm they are operating efficiently. This includes monitoring metrics such as response times, packet loss, and resource utilization. This helps identify and address issues that can impact user experience, such as slow application performance, network latency, and server downtime. Administrators can optimize network resources, improve reliability, and enhance overall user satisfaction.

Security Monitoring: Security monitoring involves detecting and responding to security threats within the network. This includes monitoring for malware infections, unauthorized access attempts, and data breaches. Techniques include intrusion detection systems (IDS), intrusion prevention systems (IPS), and log analysis to identify and mitigate security threats. Administrators are empowered to protect sensitive data, maintain regulatory compliance, and prevent costly security breaches.

Alerting and Reporting: Alerting and reporting features notify administrators of critical events or issues within the network and provide detailed reports on network performance and security. Alerts can notify administrators via email, SMS, or other means when predefined thresholds are exceeded, or anomalies are detected. Reports provide valuable insights into network performance trends, security incidents, and service level agreements (SLAs) compliance. Timely alerts and reports enable administrators to respond quickly to issues, track network performance, and make informed network management and optimization decisions.

Configuration Management: Configuration management features help ensure network devices are optimized for performance and security. This includes managing device configurations, applying configuration changes, and auditing configurations for compliance with best practices and security policies. Configuration management helps reduce the risk of misconfigurations that can lead to network downtime, security vulnerabilities, and performance issues.

Scalability and Flexibility: Network monitoring solutions should accommodate the size and complexity of your network. This includes the ability to monitor a large number of devices and network segments, as well as the ability to integrate with other systems and tools. Administrators can adapt the monitoring environment to meet changing network requirements and integrate with existing network infrastructure and management tools. Monitoring capabilities should grow with the network and meet its evolving needs.

network monitoring solutions data sources

Data Sources for Network Monitoring

Network monitoring solutions must collect and process tens of thousands of data points per second from a variety of network devices. And networks are not static: the volume of data to be processed increases as your network expands. This changes with fluctuations in network traffic, peak hours, and other factors. Network monitoring solutions that can scale dynamically to collect and process large volumes of data help administrators respond to the most current issues promptly.

These are just some example data sources:

Traffic Data: Network traffic, including the volume of traffic, the types of traffic (e.g., web traffic, email traffic), and the sources and destinations of traffic, lets administrators monitor network performance, detect anomalies, and identify potential security threats.

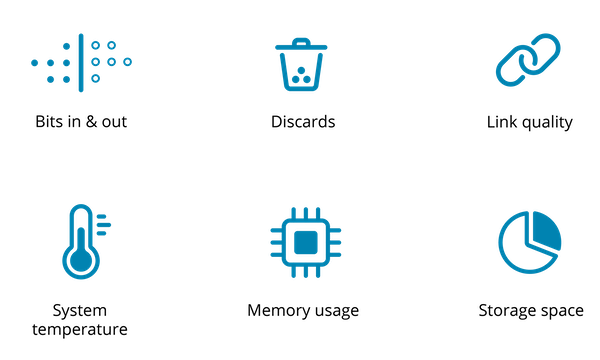
Performance Metrics: Performance metrics such as CPU usage, memory usage, disk I/O, and network bandwidth from network devices, including routers, switches, and servers, so administrators can monitor the health and performance of network devices and identify and resolve performance issues.

Configuration Data: Configuration data from network devices such as routers and switches help administrators ensure that network devices are properly configured for optimal performance and security.

Event Logs: Event logs from network devices, such as syslog messages, provide information about events and activities on network devices, such as configuration changes, security incidents, and system errors. Event logs help administrators troubleshoot issues, monitor network activity, and detect security threats.

Security Data: Firewall logs and intrusion detection/prevention system (IDS/IPS) alerts help administrators monitor network security, detect and respond to threats, and ensure that security policies are enforced.

User Activity Data: User login/logout events and application usage help administrators monitor user behavior, track user activity, and detect unauthorized access attempts.

Application Performance Data: Some network monitoring solutions can collect data on application performance, such as response times, transaction times, and error rates. This data helps administrators monitor the performance of critical applications and identify and resolve issues that may impact application performance.

Virtualized Environment Data: Data from virtualized environments, such as hypervisors and virtual machines, helps administrators monitor the performance and health of virtualized resources and ensure they’re operating efficiently.

Cloud Services Data: Data from cloud service providers, such as performance metrics, usage data, and security logs, help administrators monitor the performance, efficiency, and security of cloud services.

Quality of Service (QoS) Data: Network monitoring solutions may collect data on Quality of Service (QoS) metrics, such as latency, jitter, and packet loss, to ensure that QoS requirements are being met.

Network Topology Data: Network monitoring solutions may collect data on network topology, including the physical layout of network devices and the connections between devices. This data helps administrators visualize the network layout, identify future bottlenecks or single points of failure, and optimize network performance.

alt

Components of Network Monitoring Solutions

Network monitoring solutions typically consist of several key components that work together to enable network admins to monitor and manage their networks. The exact components may be different depending on the solution and its capabilities as well as the specific needs of the organization, but some common components include:

Data Collection Agents: These agents are installed on network devices to collect data such as performance metrics, traffic data, and event logs. Agents may be software-based or hardware-based, depending on the device and the monitoring solution.

Data Collection and Storage: Network monitoring solutions collect and store data from data collection agents. This data includes performance metrics, traffic data, event logs, and other relevant information. The data is typically stored in a database or data repository for analysis and reporting.

Data Analysis and Processing: Network monitoring solutions analyze and process the collected data to generate reports, alerts, and visualizations. This may involve applying algorithms and statistical analysis to the data to identify patterns, anomalies, and trends.

Alerting and Notification: Network monitoring solutions provide alerting and notification capabilities to alert administrators of critical events or issues. Alerts can notify administrators via email, SMS, or other means when predefined thresholds are exceeded, or anomalies are detected.

Reporting and Visualization: Network monitoring solutions provide reporting and visualization tools to help administrators understand network performance and status. Reports may include summaries of network performance, trends over time, and details of specific events or issues.

Configuration Management: Some network monitoring solutions include configuration management capabilities to manage the configuration of network devices. This may include backing up and restoring configurations, applying configuration changes, and auditing configurations for compliance with best practices and security policies.

Integration and APIs: Network monitoring solutions may offer integration with other systems and tools through APIs (Application Programming Interfaces). This allows administrators to integrate network monitoring data with other systems, such as ticketing systems, logging systems, and automation tools.

alt

Best Practices for Implementing Network Monitoring Programs

Regardless of the solution you choose, implementing a network monitoring solution consistently requires strategy, planning, measuring results. These best practices are a good place to start.

Define Clear Monitoring Objectives: Determine what aspects of the network you need to monitor (e.g., performance, availability, security) and what specific metrics are most relevant to your organization's goals.

Regularly Review and Update Monitoring Configurations: Network monitoring is not a set-it-and-forget-it task. Regularly review and update your monitoring configurations to ensure they align with your organization's changing needs and priorities. This includes adding new devices to be monitored, updating monitoring thresholds, and adjusting alerting settings.

Monitor Key Performance Indicators (KPIs): Focus on monitoring key performance indicators (KPIs) that are most relevant to your organization's goals. This might include network uptime, response times, and bandwidth utilization. Monitoring KPIs can help you identify trends and make informed decisions about network optimization and resource allocation.

Implement Comprehensive Security Monitoring: Network monitoring solutions should include robust security monitoring capabilities to detect and respond to security threats. This includes monitoring for suspicious activity, such as unauthorized access attempts and malware infections, and implementing measures to protect against these threats.

Train Staff on How to Use the Monitoring Solution Effectively: Provide training to staff on how to use the network monitoring solution effectively. This includes understanding how to interpret monitoring data, how to respond to alerts, and how to use the solution's features to troubleshoot network issues.

Integrate Monitoring Data with Other Systems: Network monitoring data can provide valuable insights when integrated with other systems, such as ticketing systems, logging systems, and automation tools. This integration can streamline network management processes and help ensure a coordinated response to network issues.

Review and Improve Monitoring Processes: This might include adding new monitoring checks, refining alerting thresholds, or implementing new monitoring tools or techniques.

distributed network monitoring solutions

Network Monitoring for Highly Distributed Networks

As your enterprise network edge expands with more devices, processes, services, and physical locations, so does the challenge of monitoring that distributed environment.

Security, privacy, reachability, and latency issues are more prevalent in highly distributed networks. This makes monitoring, collecting, and processing large volumes of data increasingly difficult.

Reaching and monitoring infrastructure, services, and applications located in remote sites within large, distributed networks can be challenging from a central location, such as a data center or the cloud. Specific roadblocks include firewalls, network address translation (NAT) traversal, overlapping IP address ranges, and locked-down environments.

A distributed environment requires an even more sophisticated and advanced network monitoring solution. It must be deployable in a dispersed configuration to reach into systems and networks that would otherwise be inaccessible while keeping the monitoring logic centralized for easier operation and administration.

To adapt to these changing environmental demands and ensure maximum uptime and optimal performance of your network, distributed network monitoring solutions should deliver:

  • Distributed data collection: Monitor all systems and networks, including remote and restricted locations beyond the traditional reach of centralized monitoring solutions.
  • Digital experience monitoring (DEM): Get different perspectives to better understand local user conditions.
  • Dynamic scaling: Adapt to changing network conditions and volumes of data collected for processing and storage.
  • Extended network access: Monitor devices with many different APIs or agents across the public internet without compromising security.
  • Centralized data visualization, storage, and alarm correlation: View data from a central location with one tool. Store data for analysis to predict and adapt. Understand your data and improve your team’s responsiveness. Delegate issues to the right people at the right time.
  • Customization: Build to your unique monitoring, workflow, and personnel needs.
alt

OpenNMS Meridian Network Monitoring

OpenNMS Meridian provides a comprehensive enterprise network monitoring solution that empowers you to ensure the availability and performance of critical network services. It’s a highly scalable open-source network monitoring solution to address all your distributed network challenges:

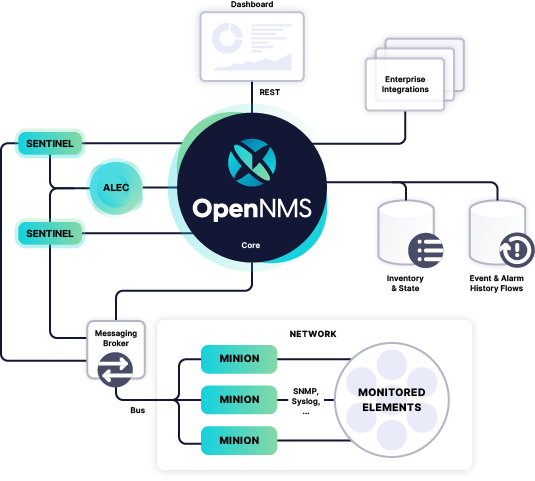
  • It leverages the OpenNMS Minion, a stateless service that communicates with devices and services in remote locations to collect network and device data.
  • With perspective monitoring, you can easily monitor the digital experience of internal services and applications from the perspective of many different physical, geographical, or logical locations.
  • In scenarios where a high volume of streaming data needs processing, OpenNMS can scale different components individually, including Minions, Kafka, Sentinel, Elasticsearch, and Time Series Databases like Cassandra and Cortex.
  • Built-in Dashboards let you visualize collected data at a glance and provide a common location to view this information. Default graphs for alarms, notifications, outages, and other predetermined insights.
  • OpenNMS Meridian provides the ability to correlate related alarms into a single “situation,” making it easier to triage and address underlying problems, reducing the amount of troubleshooting required, and improving response time.
  • Finally, OpenNMS allows flexible workflow integration with existing monitoring and management stacks. OpenNMS components and plugins, including Minions, Sentinel, and OpenNMS Plugin for Grafana, are configurable to suit your needs.
network monitoring solutions

Learn more

We hope this blog has raised your interest in learning more about using OpenNMS to monitor your distributed network.

Get the Network Monitoring with OpenNMS White Paper to see exactly how OpenNMS solves your distributed network monitoring challenges.

The post Network Monitoring Solutions: Your Complete Guide appeared first on The OpenNMS Group, Inc..

by Jen Fekin at March 06, 2024 01:18 PM

February 15, 2024

SNMP: Why it’s Still the Best Monitoring Protocol pt. 2

Security and Scalability Are Always Critical

Part one of this series on “Simple Network Management Protocol” (SNMP) looked back at the standard’s origins, explained what “simple” means in this context (hint: it doesn’t mean no complexity!), and why data structure predictability is so powerful.

In part two, we’ll look at the security and scalability benefits this protocol still delivers.

The “S” Could Stand for “Secure”

SNMP transports messages utilizing User Datagram Protocol (UDP). Unlike the alternative Transmission Control Protocol (TCP), this protocol doesn't require a connection to the receiver's network to deliver the data package. Network packets are simply sent to a destination without establishing any connection with the receiving network. The UDP connectionless protocol works more like the United States Post Office: a sender puts information in the envelope, addresses it, and the USPS drops the packet in the receiver's mailbox. The receiver doesn’t need to be home, open the door, or let the deliverer in.

On the other hand, TCP connection-oriented protocol works as if the sender put the content in an envelope, drove to a house, knocked on the door, came inside, showed their credentials, then handed the receiver the letter and confirmed they understood it.

The security risks are easy to see here. How can you be certain the sender is who you think it is? How do you know it’s not Tom Cruise in a Mission Impossible mask or a Terminator impersonating someone you know? Ensuring safety in this scenario requires a level of authentication that you can simply avoid by never opening the door. In other words, allowing outsiders access to your network opens the door to risk.

In addition, SNMPv3 can include encryption on the contents of the envelope.

Non-UDP protocols rely on the authentication of the sender and receiver to ensure the information is delivered to the right place, but the data itself is not protected. SNMPv3 can provide connectionless delivery with data encryption on the contents, making both the delivery and the data more secure.

Standard and Asynchronous Enable Scalability

Two SNMP features we discussed earlier also make the protocol more scalable: its consistent, standard data structure and its connection-less transfer format.

Getting started with a non-standard protocol may be easy and fast, but scaling and maintaining becomes harder and harder. The other protocols available today don't follow a universal standard, so they’re very unsophisticated and difficult to scale. Prometheus, for example, uses a fairly specified JSON encoding format for its own purposes, but that structure isn't defined anywhere, so you could basically send anything, and the receiver will have to do all the work on their side to unravel and understand the information.

The connectionless UDP communication model also supports scalability by enabling asynchronous delivery. In a connection-style protocol like TCP, the sender and receiver exchange communication parameters, and then a session is opened in each network and firewall to maintain the session until the conversation is concluded. This means that the sender asks for something and then waits for a response, asks for something / waits for a response, and so on. Keeping multiple connections open ties up network and receiver resources and time. One company could be maintaining 3- or 400,000 open connections at any one time. That’s a massive overhead on the network.

In an asynchronous format like UDP, the firewalls and the routers just send the packet and forget about it. Then, when the other side gets it, and it needs to send a response, they'll just send the response. The firewalls and networks aren’t maintaining sessions; no one is waiting. Network overhead is eliminated because SNMP and UDP (and OpenNMS) are not connection-oriented and are asynchronous in nature.

“Keeping multiple connections open ties up network and receiver resources and time. One company could be maintaining 3- or 400,000 open connections at any one time. That’s a massive overhead on the network.”

Conclusion

We hope you’ve found this review of the SNMP standard enlightening. This sometimes taken-for-granted protocol still has much to offer today's modern network monitoring challenges. While bandwidth may be bountiful now, it never hurts to leverage lightweight solutions like SNMP to avoid ever worrying about consumption. Its highly structured format lets network monitor tools know exactly what to expect. That and its connectionless communication format support security and scalability.

That's a ton of SNMP network monitoring value in one very small packet.

Learn more

We hope this series has raised your interest in learning more about utilizing flows and SNMP in your monitoring.

Please check out our Webinar: Flows & SNMP Explained

Marshall Massengill, OpenNMS Principal Solutions Delivery Architect, demos how you can collect, understand, and visualize SNMP flows with OpenNMS Meridian.

The post SNMP: Why it’s Still the Best Monitoring Protocol pt. 2 appeared first on The OpenNMS Group, Inc..

by Jen Fekin at February 15, 2024 02:25 PM

February 14, 2024

OpenNMS Horizon 33.0.1 (Coast Redwood)

Release 33.0.1

Release 33.0.1 is a re-release of 33.0.0, reverting the async poller changes and fixing a packaging issue.

The codename for Horizon 33.0.1 is Coast Redwood.

Bug
  • Issue installing on Debian 11 Reported by Customer (Issue NMS-16309)
  • REVERT: enable async polling by default (Issue NMS-15738)
  • Missing information in downtime model docs (Issue NMS-10133)
  • R-Core fails to install following the Horizon 30 Install Docs (Issue NMS-14777)
  • Surveillance Dashboard shows acknowledged Alarms (Issue NMS-15448)
  • Access Denied when deleting a node with admin user (Issue NMS-15746)
  • Typo in Configuring Minion via confd README (Issue NMS-15901)
  • "Dismiss" in Usage Statistics Sharing Notice is misleading (Issue NMS-16027)
  • Links in node table open both in current tab and in a new tab (Issue NMS-16047)
  • Fix Geographical Map after vue-leaflet upgrade (Issue NMS-16065)
  • Top of page search displays Show nodes with severity multiple times (Issue NMS-16067)
  • Device config upload failed with org.apache.sshd.common.SshException: EdDSA provider not supported (Issue NMS-16131)
  • Data choices plugin throws a NPE when user clicks on show collected data. (Issue NMS-16151)
  • Event parameters with <> not rendering in event/alarm views (Issue NMS-16157)
  • Users with ROLE_READONLY can add, modify, and delete alarm memos (Issue NMS-16162)
  • Docs: Meridian plugins reference wrong package names (Issue NMS-16164)
  • Fix resource types for default Postgres collection (Issue NMS-16165)
  • Service detail page displays wrong collectd package (Issue NMS-16167)
  • enlinkd logging hibernate errors (lack of unique index) (Issue NMS-16199)
  • Zookeeper 3.4.6 version mismatch in Meridian 2021 (Issue NMS-16209)
  • upgrade ActiveMQ to latest 5.15.x (Issue NMS-16218)
  • Documentation build failing: cannot find antora/xref-validator (Issue NMS-16227)
  • Node structure: fix sorting (Issue NMS-16246)
  • OpenConfig Connector parameter frequency in incorrect unit (Issue NMS-16253)
  • Container flag -t does not pass correct arguments (Issue NMS-16265)
  • Cortex plugin does not start automatically (Issue NMS-16272)
Enhancement
  • Add var-bind section into notification docs (Issue NMS-13273)
  • Provisiond threads description discrepancies (Issue NMS-14766)
  • Metadata DSL: Add metadata interpolation capability onto more threshold fields (Issue NMS-15667)
  • enable async polling by default (Issue NMS-15738)
  • Switch our Docker base to UBI (Issue NMS-15788)
  • Docs: Add install note on DNS resolution (Issue NMS-15792)
  • Extend PageSequenceMonitor to allow basic auth credentials (Issue NMS-15802)
  • Expand BlueCat DNS Data Collection (Issue NMS-15865)
  • Add confd support to Sentinel container (Issue NMS-16149)
  • Docs: Remove deprecated resourcecli section (Issue NMS-16216)
  • Update install script to clear Karaf cache (Issue NMS-16226)
  • Upgrade to latest Karaf 4.3 (Issue NMS-16249)
  • Deprecate VMware 3-5 collection/graphs (Issue NMS-16266)
  • Fix formatting in snmp-graph.properties.d files (Issue NMS-16269)
  • Docs: Update install docs for monitoring database connection (Issue NMS-16286)
  • Update container confd to default Postgres SSL to prefer (Issue NMS-16287)
Task
  • Metadata DSL: Elasticsearch Integration (Issue NMS-15752)
  • Update UI for Admin password change prompt (Issue NMS-15780)
  • Create Initial Node Structure Page (Issue NMS-16037)
  • Update UI dependencies to latest Vue3, feather, etc. (Issue NMS-16045)
  • Node structure page: Union/Intersection category filter switch (Issue NMS-16058)
  • Node structure: add unit tests (Issue NMS-16060)
  • Structured Node List: Add smoke test (Issue NMS-16061)
  • Structured node list: Export CSV/XLS (Issue NMS-16064)
  • Unzip command is missing from UBI images (Issue NMS-16087)
  • Convert Menu store to pinia (Issue NMS-16092)
  • Structured node list: UX Updates (Issue NMS-16103)
  • Structured node list: handle legacy query strings (Issue NMS-16116)
  • Structured node list: UX updates Part 2 (Issue NMS-16123)
  • Structured node list: Merge feature branch to develop (Issue NMS-16124)
  • Convert NodeStructure store to pinia (Issue NMS-16125)
  • Node structure: Add management IP address (Issue NMS-16126)
  • Node structure: Make preferences persistent (Issue NMS-16130)
  • Convert Node store to pinia (Issue NMS-16136)
  • Update Vue UI README with dev workflow instructions (Issue NMS-16142)
  • Convert more stores to pinia (Issue NMS-16144)
  • Convert auth, usageStats and other stores to pinia (Issue NMS-16154)
  • Convert deviceStore etc to pinia, remove vuex from project (Issue NMS-16156)
  • DOCS: Document structured node list (Issue NMS-16210)
  • Docs: Remove reference to opennms-cloud-plugin plugin (Issue NMS-16231)
  • Stalled threads in telemetryd parser (Issue NMS-16243)
New Feature
  • Metadata DSL: VMware Integration (Issue NMS-15753)
  • Metadata DSL: WSMAN Integration (Issue NMS-15754)
  • Metadata DSL: TL1D Integration (Issue NMS-15755)
  • Metadata DSL: JMX Data-collection (Issue NMS-15756)
  • Metadata DSL: XML Data-collection (Issue NMS-15757)
  • Metadata DSL: HTTP/HTTPS Data-collection (Issue NMS-15758)
  • Metadata DSL: Notification Credentials (Issue NMS-15759)
  • Metadata DSL: Ticketer Plugins (Issue NMS-15760)
  • Metadata DSL: Trapd Configuration (Issue NMS-15761)
  • Metadata DSL: JCIFS Monitor (Issue NMS-15762)
  • Metadata DSL: IFTTT Configuration (Issue NMS-15763)
  • Metadata DSL: Repository Configuration (Issue NMS-15764)
  • Metadata DSL: [OPTIONAL] Consistent *-config.xml Configurations (Issue NMS-15765)
  • Metadata DSL: Evaluate feasability to support metadata in Drools rules (Issue NMS-15766)
  • Metadata DSL: Change default poller and collectd configuration files to reflect ability to use metadata (Issue NMS-16016)
  • Metadata DSL: snmp-config.xml & SNMP Profiles (Issue NMS-16028)
  • Metadata DSL: change default opennms-datasources.xml to reflect the possibility of using metadata (Issue NMS-16029)
  • OpenShift: Document the impact of disabling allowPrivilegeEscalation (Issue NMS-16239)
  • Update wording to Product Update Sign Up (Issue NMS-16352)
Story
  • Metadata DSL: Documentation for Metadata DSL updates (Issue NMS-15774)
  • Document change in login password behaviour (Issue NMS-15775)
  • Smoke test for Admin password change (Issue NMS-15866)
  • Admin Password Change: UX Review and Updates (Issue NMS-15867)
  • Admin Password Change: Merge to develop (Issue NMS-15868)
  • User is redirected to landing page after password change is done (Issue NMS-16036)
  • Use pinia instead of vuex in Vue UI (Issue NMS-16043)
  • Add pinia stores to UI but do not yet activate them (Issue NMS-16068)
  • Metadata DSL: Persist poller parameters as meta data (Issue NMS-16146)
  • Node structure: more query params (fs:fid, snmp, sys) (Issue NMS-16197)
  • Remove plugin opennms-cloud-plugin from installation (Issue NMS-16219)
  • Geo Map: enable user-defined map to be the default one (Issue NMS-16229)
  • DOCS: Document Geographical Map user-defined map (Issue NMS-16230)
  • Add node-gyp to fix CircleCI build-ui errors (Issue NMS-16242)
  • News Feed: UI Panel and REST Service (Issue NMS-16282)
  • Web UI for User Data Collection (Issue NMS-16283)
  • User Data Collection: Database / Rest / CM work (Issue NMS-16284)
Epic
  • Opt-In User Data: Name, email and company Collection (Issue NMS-16279)

by mershad-manesh at February 14, 2024 11:44 PM

February 2024 Releases – Horizon 33.0.1, 2023.1.13, 2022.1.25, 2021.1.36

In February, we released updates to all OpenNMS Meridian versions under active support, as well as Horizon 33.0.1.

Meridian Stable Updates

Meridians 2023.1.13, 2022.1.25, 2021.1.36 contains a bunch of small bugfixes along with other improvements.

For a list of changes, see the release notes:

Horizon 33.0.1

Release 33.0.1 is a re-release of 33.0.0 with a rollback of a change related to asynchronous polling. Horizon 33 contains a bunch of changes, including metadata support in many more configs, a revamped node list, and more...

For a high-level overview of what has changed in Horizon 33, see What’s New in OpenNMS Horizon 33.

For a complete list of changes, see the changelog.

The codename for Horizon 33.0.1 is Coast Redwood.

The post February 2024 Releases – Horizon 33.0.1, 2023.1.13, 2022.1.25, 2021.1.36 appeared first on The OpenNMS Group, Inc..

by Morteza Ershad-Manesh at February 14, 2024 05:51 PM

February 08, 2024

SNMP: Why it’s Still the Best Monitoring Protocol pt. 1

A Simple and Structured Approach Delivers Big Benefits

If you’re someone with a long history in the network monitoring space, you’ve seen trends in standards and protocols come and go over the years.

In this two-part blog series, we discuss one that deserves a second look: SNMP or “Simple Network Management Protocol.” It delivers lightweight bandwidth requirements, a predictable data format, security benefits, and asynchronous scalability. These advantages make it still one of the best monitoring protocols available today.

SNMP History

When networking was in its infancy, as with many new technologies, there were many competing approaches to handling the infrastructure that made the physical connections as well as the protocols that ran on those physical connections. Novell and Microsoft, for example, were big proponents of their own protocols. But in the end, the common Internet Protocol, or IP standard, won out. With that came a big boom in the networking industry.

Once there was a connectivity standard, the need for a complementary standard for monitoring the data and programs moving over networks became clear. A group of network engineers created a task force to develop, publish, and ratify the standard that became SNMP or “Simple Network Management Protocol.” By 1990, the Internet Architecture Board (IAB) approved SNMP v1 as the Internet standard for network management but continued to optimize the standard through more iterations:

  • SNMPv1 worked just fine in a time when networks were still very, very private, and security wasn't a significant concern.
  • SNMPv2 was introduced when the Internet came around, and networks started becoming interconnected. People could communicate to outside networks from computers within their own private networks, exposing their systems and data with SNMP. Security became a concern, so v2 included an authentication component that, unfortunately, became too complex to manage efficiently.
  • SNMPv2c reverted to a previous version of SNMP used by communities with the community name as the authenticator. This has become the standard version of SNMPv2.
  • SNMPv3 includes features to beef up security even further: encryption and authentication of the source. The information inside the envelope is encrypted, and you have the key to decrypt it on the acceptance side. Both SNMPv2c and SNMPv3 are relatively common with v3 being the standard that more security-focused companies are adopting.

A Simple Protocol for Limited Bandwidth

Some of us already know that the "S" stands for "simple," but why was simple a critical component? When SNMP was designed 40 years ago, bandwidth was at a premium. In 1984, total global Internet traffic was 15 Gigabytes per month. Monitoring network traffic could be a little like quantum mechanics: because monitoring tools were so heavy, you couldn’t observe the traffic without affecting the results.

Back in the late 90s, monitoring could make up 20% of network traffic. That’s why the protocol had to be so lightweight: you couldn’t get people to use the protocol or even monitor the network if monitoring took up too much bandwidth.

Today, SNMP traffic doesn't even appear in monitoring reports because the footprint is so small compared to the available bandwidth and network usage. That’s the advantage of utilizing a protocol designed when bandwidth was a premium in a time when bandwidth is a commodity.

However, “simple” means it is lightweight in terms of bandwidth, but it turns out the protocol was really only considered simple by network engineers. Monitoring is a complex subject, and no matter how you approach the task, that complexity has to go somewhere. If you simplify the network communications, the complexity gets pushed out to the applications doing the monitoring.

“Monitoring is a complex subject, and no matter how you approach the task, that complexity has to go somewhere.”

Standard Data Structure Delivers Predictability

SNMP’s standard specifies five core protocol data units (PDUs) that make data easier to parse on the receiver or application side. Network engineers know every field of that packet and expect it to be structured in a specific way: if there's a certain byte here and another byte there, they know exactly what each byte means, and can decode it on the receiving end. It requires that users be able to understand how to structure and code the request, encrypt the request, get it into that packet, send it over, and then, on the receiving side, do the same thing. Setting up this structured packet requires some complex work.

One approach to avoiding this complexity is to use an unstructured or non-standard protocol. The problem is that this just pushes complexity to the edges. The application or user needs to take all the non-standard data and parse it into a structure that means something. It gets stored in an unstructured data store and then multi-indexed by that technology so that users can actually find and use it. And since it's not a recognized standard, someone could decide to change the data format on a whim, putting you back at square one.

Nobody took the time to abstract SNMP’s operational complexity away because it's a complicated application to write. That was one of the reasons other protocols found a foothold; some people thought, “I don't want to keep training on this SNMP thing – it's too hard.”

However, SNMP is a very simple, lightweight message that can supply huge impacts. With this format, just a few bytes on the network can deliver a surprising amount of data.

Conclusion

As you can see, there’s more to this “simple” protocol than meets the eye. It delivers a light load on bandwidth in a structured, predictable format – with benefits you can only get from a recognized industry standard. Part 2 will dig into how SNMP’s stable standard, connectionless approach, and encryption capabilities deliver security with scalability.

Learn more

We hope this series has raised your interest in learning more about utilizing flows and SNMP in your monitoring.

Please check out our Webinar: Flows & SNMP Explained

Marshall Massengill, OpenNMS Principal Solutions Delivery Architect, demos how you can collect, understand, and visualize SNMP flows with OpenNMS Meridian.

The post SNMP: Why it’s Still the Best Monitoring Protocol pt. 1 appeared first on The OpenNMS Group, Inc..

by Jen Fekin at February 08, 2024 01:12 PM

January 10, 2024

January 2024 Releases – Horizon 32.0.6, 2023.1.12, 2022.1.24, 2021.1.35

In January, we released updates to all OpenNMS Meridian versions under active support, as well as Horizon 32.0.6.

Meridian Stable Updates

Meridians 2023.1.12, 2022.1.24, 2021.1.35 contains a bunch of small enhancements to aid in debugging along with other minor improvements.

For a list of changes, see the release notes:

Horizon 32.0.6

Release 32.0.6 contains a bunch of changes including UI cleanups, a number of access/role fixes, and other bug fixes, plus a ton of documentation updates and a new feature to show news and tips from an RSS feed in the UI.

For a high-level overview of what has changed in Horizon 32, see What’s New in OpenNMS Horizon 32.

For a complete list of changes, see the changelog.

The codename for Horizon 32.0.6 is Breakcore.

The post January 2024 Releases – Horizon 32.0.6, 2023.1.12, 2022.1.24, 2021.1.35 appeared first on The OpenNMS Group, Inc..

by Morteza Ershad-Manesh at January 10, 2024 04:44 PM

OpenNMS Horizon 32.0.6 (Breakcore)

Release 32.0.6

Release 32.0.6 contains a bunch of changes including UI cleanups, a number of access/role fixes, and other bug fixes, plus a ton of documentation updates and a new feature to show news and tips from an RSS feed in the UI.

The codename for Horizon 32.0.6 is Breakcore.

Bug
  • Missing information in downtime model docs (Issue NMS-10133)
  • R-Core fails to install following the Horizon 30 Install Docs (Issue NMS-14777)
  • Surveillance Dashboard shows acknowledged Alarms (Issue NMS-15448)
  • Access Denied when deleting a node with admin user (Issue NMS-15746)
  • Event parameters with <> not rendering in event/alarm views (Issue NMS-16157)
  • Users with ROLE_READONLY can add, modify, and delete alarm memos (Issue NMS-16162)
  • Events: filter and advanced search / method GET is not supported (Issue NMS-16232)
  • VmwareCimMonitor/VmwareCimCollector not working anymore (Issue NMS-16236)
  • OpenConfig Connector parameter frequency in incorrect unit (Issue NMS-16253)
  • Container flag -t does not pass correct arguments (Issue NMS-16265)
  • OpenConfig server logs invalid sample interval unit ?s when frequency is set to 4 digits or higher (Issue NMS-16280)
  • LegacyDatetimeFormatterTest.testParse fails to parse date time when locale is set to en_CA-UTF-8 (Issue NMS-16288)
Enhancement
  • Add command to Karaf shell to manually trigger Metadata Adapter (Issue NMS-13922)
  • Karaf command to display event details (Issue NMS-15130)
  • Add debug logging to SNMP Property Extenders on match failure (Issue NMS-15743)
  • Remove plugin opennms-cloud-plugin from installation (Issue NMS-16219)
  • Update install script to clear Karaf cache (Issue NMS-16226)
  • Docs: Remove reference to opennms-cloud-plugin plugin (Issue NMS-16231)
  • OpenShift: Document the impact of disabling allowPrivilegeEscalation (Issue NMS-16239)
  • RSS Feeds Panel showing OpenNMS Blog content (Issue NMS-16250)
  • Document RSS feature (Issue NMS-16255)
  • Docs: Create documentation on how to create graph definitions (Issue NMS-16258)
  • News Feed: UI Panel and REST Service (Issue NMS-16282)
  • Docs: Update install docs for monitoring database connection (Issue NMS-16286)
  • Update container confd to default Postgres SSL to prefer (Issue NMS-16287)

by mershad-manesh at January 10, 2024 04:44 PM

December 27, 2023

From Pirate to Proven: 20 Years in Open-Source Network Management pt. 3

Dr. Craig Gallen looks back over his history with open-source network management and the TM Forum.

In the final part of this series, he collects 4 key learnings on how to successfully move open-source initiatives forward.

Thinking back and looking forwards, what have we learned from the last twenty years of involvement in TM Forum programs and push for open-source network management solutions?

1) Crisis opens the door to change.

As in the early 2000's when the telecoms bust opened the door to the possibility of open-source solutions, today we are seeing a renewed interest in open source as pressure on margins and competition from Hyperscale cloud providers are forcing service providers to look for more cost-effective solutions.

2) Software is a fashion industry.

It seems that new technologies wax and wane in popularity. You can put your heart and soul into a project only to have it marginalized to irrelevance. Every interface initiative has eventually been eclipsed by a new technology so it is important to invest just enough to track changes but not bet the farm on a technology which might be replaced in a couple of years. Several companies learnt that lesson the hard way through the TIP program.

The trick, particularly for a small company is to put enough investment in to signal interest and show thought leadership but be prepared to move on quickly if the work isn't driving business. If, however, customers like the work then the early experiments can be productized quickly.

3) Open-source network management tools need a sustaining revenue steam.

It appears that the latest interface program has learnt this lesson and has employed some developers to sustain the tools. A clear advantage is that the core open source OpenAPI tools are maintained and used by a community to which the TM Forum contribute rather than own. The small TM Forum sustaining team allows occasional contributors (i.e., the majority of TM Forum members) to make their contribution which is then merged and sustained in the wider code base. One can only hope that this will be a long-term commitment on the TM Forum's part.

A parallel observation would be that the interface program may be trying to do too much for the sustaining efforts to be effective. The first interfaces from this program were pretty much handcrafted and not necessarily consistent in data types or interaction patterns. Later, a more consistent core entity model and newer HATEOAS based design patterns have been introduced. Additionally, plans are afoot to provide AsyncAPI based implementations of some of these same interfaces.

Consequently, there are now over 50 interfaces, each of which need ongoing sustaining effort to migrate them all to the same level of compliance and to fix bugs or add necessary enhancements. Furthermore, these interfaces were originally developed by different expert teams which have since disbanded, and the documentation on the use cases for each interface can be patchy.

All of this potential churn adds uncertainty to adoption. Do I use the currently published version or wait for the latest tooling to be released? Do I treat these interfaces as 'good starting points' for my architecture or as a mandatory set of compliance requirements?

Other advanced initiatives such as the TM Forum canvas are complex and also need reference implementations which are widely visible to drive adoption. It would be very beneficial if the canvas program could contribute upstream to make the canvas a component which is sustained in the Kubernetes ecosystem.

4) Open education, examples, and documentation are critical to adoption.

This leads into my final point. Technology creators need to promote the network effects of adoption - i.e., the more people who use a technology the more valuable it becomes.

In particular, it is important that a potential adopter can evaluate a new technology quickly and determine how much effort will be required to learn how to use it properly. Insufficient documentation sends a bad message that the technology is either too difficult or that the creator does not support the technology on an ongoing basis.

While much of the tooling and many of the interfaces are now published on GitHub, the documentation and team communications are still restricted to TM Forum members. I believe this significantly hampers the reach and uptake of the interface work and also prevents contributions from experts outside of the TM Forum community.

The interfaces could have real value for the wider IT community. A more serious commitment to promoting the interfaces through open source would help.

Conclusion

I’ve found that TM Forum has navigated the difficult balance between being both a member trade association and a standards creator. It has managed to remain relevant to its core membership and deliver some very useful technology innovations to the wider industry.

I think the direction is positive and hope that OpenNMS will be able to continue to make tangible contributions towards API development and adoption in the coming years as open source continues to be proven out as a viable approach to open-source network monitoring standards.

Learn more

We hope this series has raised your interest in learning more about or even participating in the OpenNMS community. Your conversation and collaboration are what brings open-source solutions to life.

Please take a moment to see how you can get involved.

The post From Pirate to Proven: 20 Years in Open-Source Network Management pt. 3 appeared first on The OpenNMS Group, Inc..

by Craig Gallen at December 27, 2023 03:20 PM

December 19, 2023

From Pirate to Proven: 20 Years in Open-Source Network Management pt. 2

Dr. Craig Gallen looks back over his history with open-source network management and the TM Forum.

In the second part of this series, he dives into the history of interface programs including the rise and fall of TIP and the growth of OpenAPI.

Around 2008, the TM Forum desired to create a more implementation neutral interface technology based on WSDL (Web Services Description Language). The new TM Forum Interface Program was led by Steve Fratini from Telcordia and (unimaginatively) referred to as TIP. The objective of the program was to use model driven engineering to generate WSDL interfaces and PDF documentation directly from the TM Forum SID.

By now open source network management was somewhat on the TM Forum's agenda. The TIP tooling, called the Joint Open-Source Interface Framework (JOSIF) was to be completely open source and was based on Eclipse Tigerstripe, a tool originally developed to help create OSS/J interfaces. However, although the tooling was open source, the resulting interfaces’ artifacts were mostly still restricted to only TM Forum members.

After I finished my doctorate, OpenNMS agreed to sponsor my work with the TIP program. The hope was that OpenNMS could contribute open-source expertise and ultimately implement these interfaces on top of OpenNMS thus exhibiting thought leadership in the TM Forum.

I participated heavily in this program on behalf of OpenNMS for about 3 years and OpenNMS also participated in a number of catalysts demonstrating integration to other vendors using the TIP interfaces.

TIP Loses Traction

The TIP interfaces are still available, but like OSS/J, TIP was superseded by later developments. The TIP program ultimately closed because of three factors.

Firstly, it was targeting WSDL, and the industry began to favour ReST interfaces using JSON.

Secondly, with hindsight it was a mistake to try and use the TM Forum Information Framework (SID) UML model as the starting point for interface definition. Using the SID made the tooling complicated to learn and use. We came to realize that the SID as an information model was not optimized for interface definition. OSS/J had avoided this trap by creating an intermediate data model, but TIP mistakenly tried to tie interface definitions directly back to the SID UML.

Thirdly, and perhaps most importantly, the cost of maintaining the open-source TIP tooling was difficult to sustain within the small TM Forum community. Although it was actively promoted to other standards organizations such as the ITU-T, the tooling really never reached critical mass adoption both within and outside the TM Forum.

After their initial enthusiasm, various contributors began to reign back their involvement and sustaining development of the capability fell on fewer and fewer members until eventually the program could not continue.

OpenAPI Gains Wide Support

As TIP was becoming a legacy project, another interface program began to emerge under the leadership of Pierre Gautier. The wider IT industry was becoming aware of a new technology neutral interface definition language called Swagger (now OpenAPI) that had a set of code generators which could generate reference code and documentation. OpenAPI was getting wide adoption and the TM Forum decided to start a program to create a set of ReST / Json interfaces using OpenAPI.

The big difference was that the OpenAPI tooling was commercially supported (by Smart Bear) and already had a wide following outside of the telecoms industry. The TM Forum additionally agreed to fund several developers to contribute to the tooling and adapt it to TM Forum needs.

This reflected the lessons learnt in supporting the TIP tooling where all of the resources came only from individual TM Forum members. Someone needs to centrally own the sustaining of the project, and this can’t fall on individual contributors. Having spent a lot of effort on the previous TIP incarnation which had limited commercial adoption, OpenNMS has been more cautiously involved in the newer interface program.

Part 3

The last part of this series, I’ll wrap up what I’ve learned from twenty years of experience with open-source network monitoring technologies and TM Forum.

The post From Pirate to Proven: 20 Years in Open-Source Network Management pt. 2 appeared first on The OpenNMS Group, Inc..

by Craig Gallen at December 19, 2023 08:22 PM

December 14, 2023

December 2023 Releases – Meridian 2023.1.11, 2022.1.23, 2021.1.34

In December, we released updates to all OpenNMS Meridian versions under active support.

Meridian Stable Updates

Meridians 2022.1.23, 2021.1.34 contains a few small bug fixes.

Meridian 2023.1.11, contains a bunch of documentation updates, bug fixes, some major security-focused upgrades including Karaf and Camel and one fix related to the Metadata REST service.

For a list of changes, see the release notes:

The post December 2023 Releases – Meridian 2023.1.11, 2022.1.23, 2021.1.34 appeared first on The OpenNMS Group, Inc..

by Morteza Ershad-Manesh at December 14, 2023 01:23 AM

December 13, 2023

From Pirate to Proven: 20 Years in Open-Source Network Management pt. 1

Dr. Craig Gallen looks back over his history with open-source network management and the TM Forum.

In the first part of this series, he covers the kick off of the 'open-source pirates' at TM Forum Nice 2004 to open source coming into its own and starting to compete with commercial solutions.

In 2004, the telecoms bubble had burst, and the telecoms industry was still in shock with over 500,000 layoffs and $2 Trillion Dollars of value wiped out globally. Over-investment in fibre capacity and 3G licenses had left many suppliers and operators on the verge of bankruptcy.

This did not seem a particularly auspicious time to launch a new project, but I had just started Doctoral Research at Southampton University and wanted to investigate the potential of Open Source network management in the telecoms industry.

The Telecom Bust Opens the Door to Open-Source

My first step was to somewhat nervously propose an open source 'Birds Of a Feather' (BOF) session at TMW Nice 2004. The session attracted a lot more interest than expected, and it seemed industry players were more willing to consider the open-source network management option as they desperately looked for opportunities to de-risk R&D investments and reduce overall IT costs. The TM Forum also saw this as a possible new strand to increase the value of participation.

BT, Agilent, and Sun (now Oracle) all generously sponsored several Southampton University undergraduates to work with me on an open-source proof of concept (PoC) through the summer before traveling to demonstrate it at another BOF in October 2004 at TMW Long Beach.

In the course of my research, I discovered OpenNMS – one of the few scalable open-source network management tools in existence at that time. It also appeared to be the only open-source network management platform written in Java which was a viable candidate for integration using OSS through Java (OSS/J) APIs.

I decided to use it as part of the PoC.

The OpenNMS company had just been founded, and I met CEO David Hustace when he travelled to join us for the demonstration in Long Beach. That was the start of more than twenty years of working together on OpenNMS.

TMW Long Beach raised even more interest in the possibilities of open-source, and we began to be referred to by TM Forum members as the 'open-source pirates'.

OpenOSS Brings Open-Source Full Circle

But not everyone was happy. Questions were asked at board level by some of the software vendors concerned about whether the TM Forum should be getting involved in open source. Fortunately, their objections did not prevail, and the BOF excited a group of people who were invited to a two-day workshop at the University of Southampton later that year. The workshop agreed to a set of objectives for what was to become the OpenOSS catalyst project.

TM Forum were then heavily promoting NGOSS, the Next Generation Operations Support System architecture (which was a precursor to today's TM Forum Open Digital Architecture). The Southampton workshop was able to broker a link between the open-source catalyst and a parallel NGOSS Model Driven Architecture catalyst. The OpenOSS catalyst would be modeled in UML as NGOSS contracts by the NGOSS catalyst team. The OpenOSS catalyst team was initiated at Team Action Week in January 2005, and the catalyst presented with Southampton students at TMW Nice in May 2005.

The catalyst demonstrated to TM Forum members for the first time that open source network management could enable collaboration, research, and education around TM Forum technologies, just a year from the first open-source BOF session.

Open-Source Starts to Compete with Commercial

Sun (Oracle) had previously initiated the OSS through Java (OSS/J) program in collaboration with a number of TM Forum members but outside of the TM Forum because of intellectual property rights issues. The objective of OSS/J was to encourage the use of the Java ecosystem (J2EE and XML over JMS) to develop OSS components which reflected the TM Forum's NGOSS design principles. OSS/J standardized a number of common OSS interfaces and the Java Community Process mandated that each published API had a publicly available Reference Implementation (RI) and Compatibility Test Kit (CTK).

Although the RI and CTK's were not necessarily published under a fully open-source license, OSS/J was clearly demonstrating that standards adoption would be greatly helped by examples which developers could leverage in their own products. Major Java enterprise components were increasingly developed as open-source projects and as these projects matured, they were becoming sufficiently functional to compete with their commercial equivalents. (Indeed, as part of Oracle's acquisition of Sun, the Java code base was itself open source as Open JDK). OSS/J APIs are still used in the industry and OSS/J was eventually subsumed into the TM Forum, but OSS/J reduced in popularity as the XML and EJB technologies on which it is based became less fashionable among developers.

Part 2

In the next part of this series, I’ll cover the development, adoption and abandonment of interface technology TIP and the rise of OpenAPI in the network management toolset.

The post From Pirate to Proven: 20 Years in Open-Source Network Management pt. 1 appeared first on The OpenNMS Group, Inc..

by Craig Gallen at December 13, 2023 06:09 PM

December 05, 2023

Splunk Acquisition Brings Cloud Costs into Focus

Rather than pay the Splunk bill, Cisco just bought the company.

Cisco’s planned acquisition of Splunk has caused ripples across the network and security ecosystem since it was announced in September 2023. It may be a win for both by bringing together Splunk’s cybersecurity with Cisco’s network data, but as with any merger, there are some questions.

In this case, I’ve seen concerns around the potential culture clash, the pace of innovation, and especially how this could affect Splunk costs.

Observability costs can already spiral, surprisingly, out of control as demonstrated by Datadog’s shocking $65M/year customer bill (hint: it was Coinbase). Unfortunately, when budgets are tight and customer-facing services are sacrosanct, observability might be first on the chopping block when companies are looking to shave 10% off quarterly cloud costs.

Some vendors have reacted to the issue of steeply rising spending on observability metrics by introducing a way to pull together unused and partly used metrics into lower cardinality versions to reduce costs.

In this blog, I’m going to take a look at what’s driving these growing cloud costs and how they can be curbed so monitoring doesn’t have to be sacrificed.

Hazy Cloud Costs

When services like Splunk and Datadog and others first launched, one of the key promises of the cloud-delivery model was scalability – companies could use as little or as much of the service as they needed. But as the model has expanded over time, we’re starting to see some cracks along with the benefits:

alt

Complex Contracts
You may run into a menu that offers hundreds of ways the services can be priced and combined – by user, feature, device, or more – and end up paying more for the “flexibility” of buying a la carte. It's like a new car purchase where you choose the model, the trim, the colors, and the add-on features as packages or priced separately. It’s not always easy to compare the options: you might find that the price is different for each feature depending on which base model you select, or you even forget to include cruise control!

alt

Per Metric Pricing
Cruise control is a no-brainer, but how can you be sure which optional metrics you should include to track with your monitoring service? How can you know where the problem will crop up? How can you know what data you need to collect before you collect and review the data? Without the ability to see the whole picture, you can end up with blind spots that just happen to be the source of a network-crashing crisis. You could choose to monitor everything, but with a la carte pricing, can you afford it? Or maybe you realize after you’ve signed the contract that you missed critical metrics and adding them requires going back for more budget each time. How flexible is that?

alt

Unpredictable consumption costs
Once you choose your options, the price can still vary. Again, this can be one of the advantages of a cloud-based service, but as we’ve seen in the last few years, this can become a drawback instead. Imagine the same car, but your monthly payment changes based on how much you drive. Cost conscience organizations want to keep spend under control and predictable. As we reach year-end, this is especially important for companies trying to lock in budgets for next year. A cloud-based service loses its scalability advantage if the only way to make the cost predictable is to lock in the usage and not scale to the usage you actually need.

The Predictability of OpenNMS

Before joining OpenNMS, I was in the position to make the decision on which network monitoring solution to utilize. The non-profit I worked for was very budget-conscious, so having a predictable cost for network monitoring was critical but so was the scope of coverage. To avoid the blind spots and surprises listed above, we chose the on-premises implementation of OpenNMS Meridian.

With OpenNMS, everything is included, and the pricing is straightforward – there’s no piecemeal solution, no picking and choosing between metrics, no consumption-based costs. I never had to justify what I was measuring, why, or how much. We could plan and predict the cost and coverage.

When something happened, this let me turn the conversation from “The network is broken” to “The network isn’t broken, and I have the data to prove it. Do you?”

Conclusion

As cloud software usage has grown, most companies have run into the nasty shock of a surprisingly large bill at the end of the month. Elasticity is, in effect, gone when you have to justify additional budget to expand the solution, or you simply can't because the planned budget doesn't allow it. This is scale in name only.

The first line of this blog is a joke but with a painful, realistic point: even the best-funded companies can feel the burn of scaling cloud software costs.

For organizations requiring more predictability without sacrificing visibility (and can't afford to just buy the company!), it's worth exploring other options.

The post Splunk Acquisition Brings Cloud Costs into Focus appeared first on The OpenNMS Group, Inc..

by Mike Huot at December 05, 2023 03:34 PM

November 30, 2023

Ask a Network Monitoring Expert

Find yourself stuck in the maze of network issues? Frustrated by monitoring problems you just can't seem to untangle? Full of network monitoring questions? Not sure how to take your network monitoring to the next level? We get it!

While ChatGPT can give you the answers to some of life’s big questions, there are still key insights you can only get from real people – like our OpenNMS experts.

With our “Ask an Expert” sessions, you can schedule time with real OpenNMS gurus to have a real conversation with an experienced network monitoring professional. No jargon, no tech-heavy mumbo-jumbo—just friendly advice, suggestions, and answers to your network monitoring questions.

Solve Complex Network Monitoring Challenges

Just fill out the contact form. Choose a date and time that works for you (we'll provide calendar links and an email for your convenience). Come to the session prepared with your questions, issues, and concerns.

Final step: have a fun, engaging, enlightening chat with people who have deep domain expertise.

Our Experts

network monitoring questions

Dr. Craig Gallen
Business Development Manager, OpenNMS

Dr Craig Gallen has been a committer to OpenNMS for over 10 years. He has worked as an engineer in broadcasting, telecommunications, and academia where his doctoral research explored the role of Open Source in the Telecommunications industry. Presently Craig splits his time between teaching at Solent University Southampton and influencing the strategic direction of OpenNMS.

network monitoring questions

Mike Huot
Principal Product Strategist, OpenNMS

Mike offers a blend of strategic leadership and technical expertise, with a focus on monitoring and infrastructure management. As Principal Product Strategist and Infrastructure Architect, he’s led diverse initiatives, overseeing deployment and automation across networking, computing, virtualization, storage, and cloud, emphasizing monitoring and observability. At OpenNMS, he shares expertise, advocates for open-source solutions, and engages in community collaboration. He balances hands-on technical work with strategic input, driving product direction and enhancing network performance management, while contributing to the OpenNMS community.

What to Expect

alt

Friendly chats: Nothing formal here, just relevant information and inspiring conversation with some knowledgeable people from OpenNMS.

alt

Live demos: See how OpenNMS Meridian works and how you can use it to address your most challenging network needs.

alt

Sneak peeks: Be the first to glimpse behind the curtains. We might just share some upcoming features and projects we're excited about.

Want to learn on your own? That works too!

If your schedule doesn’t allow you to carve a specific time out of your day for a conversation, no problem. As an open-source solution, OpenNMS has a community of users ready and willing to lend a helping hand. You can dig through the available resources on your own or join our community to connect with other users facing the same issues.

Explore our resources

Visit our website to access a wealth of informative content, including product documentation, resources, and customer testimonials.

Join the community

Connect with like-minded professionals and OpenNMS users on our community forums or chat to share insights and experiences.

The post Ask a Network Monitoring Expert appeared first on The OpenNMS Group, Inc..

by Jen Fekin at November 30, 2023 04:16 PM

November 08, 2023

OpenNMS Horizon 32.0.5 (Deep Swedish Rock)

Release 32.0.5

Release 32.0.5 contains a bunch of security updates to Drools, Hibernate, Jetty, and more, plus a number of other bug fixes and a slew of documentation updates.

The codename for Horizon 32.0.5 is Deep Swedish Rock.

Enhancement
  • BMP docs could use some TLC (Issue NMS-13891)
  • Provisiond threads description discrepancies (Issue NMS-14766)
  • OpenShift: Documentation (Issue NMS-16108)
  • Backport Drools 8.x to foundation 2023 to address a couple of CVEs (Issue NMS-16179)
  • Integrate hibernate-core related patch from Debian (Issue NMS-16181)
  • Version bump of json for CVE-2023-5072 (Issue NMS-16191)
  • Version bump of jetty to 9.4.53 version (Issue NMS-16192)
  • Bump to the latest netty 4 version (Issue NMS-16193)
  • Version bump of snappy java (Issue NMS-16194)
  • Docs: Remove deprecated resourcecli section (Issue NMS-16216)
  • Post install/upgrade instructions on how to join OpenNMS Community (Issue NMS-16213)
Bug
  • Local Geo Map (using gwt.openlayers.url) working in version 29.0.1 is not anymore in 31.0.3-1 (Issue NMS-15400)
  • Access Denied when deleting a node with admin user (Issue NMS-15746)
  • Map dashlet for Ops Boards references old map systems (Issue NMS-16044)
  • Reports → Chart page does not load graphs (Issue NMS-16085)
  • Event parameters with <> not rendering in event/alarm views (Issue NMS-16157)
  • Add Basic Auth to OpenConfig gNMI for Call Credentials (Issue NMS-16158)

by mershad-manesh at November 08, 2023 04:14 PM

November 2023 Releases – Horizon 32.0.5, 2023.1.9, 2022.1.22, 2021.1.33

In November, we released updates to all OpenNMS Meridian versions under active support, as well as Horizon 32.0.5.

Meridian Stable Updates

Meridians 2023.1.9, 2022.1.22, 2021.1.33 contains a bunch of security updates to Drools, Hibernate, Jetty, and more, plus a number of other bug fixes and a slew of documentation updates.

For a list of changes, see the release notes:

Horizon 32.0.5

Release 32.0.5 contains a bunch of security updates to Drools, Hibernate, Jetty, and more, plus a number of other bug fixes and a slew of documentation updates.

For a high-level overview of what has changed in Horizon 32, see What’s New in OpenNMS Horizon 32.

For a complete list of changes, see the changelog.

The codename for Horizon 32.0.5 is Deep Swedish Rock.

The post November 2023 Releases – Horizon 32.0.5, 2023.1.9, 2022.1.22, 2021.1.33 appeared first on The OpenNMS Group, Inc..

by Morteza Ershad-Manesh at November 08, 2023 04:10 PM

October 24, 2023

An Interview with Horizon User, Jesus Palacio: Part 2

We're highlighting Jesus Palacio, CTO of Urbalink Networks, and an OpenNMS Horizon user for more than 20 years.

In the first part of our interview, we got to know Jesus and how he got started using OpenNMS.

In the second, and final, part of our interview, we'll learn how he chose OpenNMS and the benefits he's seen from using Horizon as his preferred network monitoring platform.

What were the criteria you used to choose OpenNMS?

"When I decided to choose OpenNMS, I used the following criteria:

  • Open source: This is important to me because I wanted to be able to customize OpenNMS to meet the specific needs of my organization.
  • Scalability: I wanted to be able to use OpenNMS to monitor my network as it grows in the future.
  • Features: I wanted a software that could monitor all aspects of my network.
  • Community: OpenNMS has a large and active community of users and developers you can interact with in forums and mailing lists to get help.
  • Cost: Last, but not least, saving costs."
Jesus Palacio of Urbalink Networks standing

Why do you continue to you choose OpenNMS?

"For me, the most important aspect of OpenNMS is its customizability. It is an enterprise-grade solution, but it still allows you to define exactly what and how to monitor, and to establish under which conditions you will receive an alert when something happens in your network. It has a wide range of features that makes it suitable for almost every need and situation.

This is why I describe it as the "Swiss Army Knife" of network monitoring. Other important aspects I took into account when choosing OpenNMS over other solutions include:

  • It has a large and helpful community
  • It can monitor large networks, it can grow with your company
  • No hidden costs or fees to enable features ,you can maintain it completely on your own.
  • The solution has been evolving constantly and adding very helpful features."
alt

Urbalink Network's OpenNMS Horizon dashboard

How does OpenNMS help you achieve your objectives?

"Network monitoring software should be flexible enough to provide an at-a-glance overview of the current status of your network, with critical metrics from routers, switches, firewalls, servers, services, application, URLs, printers, UPS, and other infrastructure devices. We’ve provided solutions using OpenNMS and helped them adjust the platform to monitor the required specifics that can help administrators quickly troubleshoot problems and overview metrics metrics to make decisions proactively in order to avoid unnecessary downtime in their services.

Some of the most common metrics we used to track are:

  • Device uptime: The most straightforward, high-level KPI is uptime, which measures the fundamental goal: how often the service is available.
  • Network traffic: In our actual use case this metric tracks the amount of network traffic that is flowing through a device or a network. This help us to identify devices that are experiencing congestion and make adjustments on the fly.
  • Packet loss and re-transmissions: Packet loss often signals interference or congestion on the network. A common symptom of this issue is data transferring from one device to another but not entirely reaching its destination. Monitoring packet loss is vital because it's a surrogate for the wireless network's overall health.

By tracking these metrics, we gain valuable insights into the performance of our network and business."

alt

OpenNMS Horizon maps Urbalink Network's network

Can you measure any reduced costs, thanks to OpenNMS?

"Since the average cost of a license for a network monitoring solution goes from more than $2,000 for the first year of use up to $30,000 or $50,000, there is a clear reduction in costs when you use OpenNMS Horizon. Of course, you have to keep in mind that you need to have the skills to maintain the solution adapted to your needs. Even when there’s an active and supportive community, skills are required.
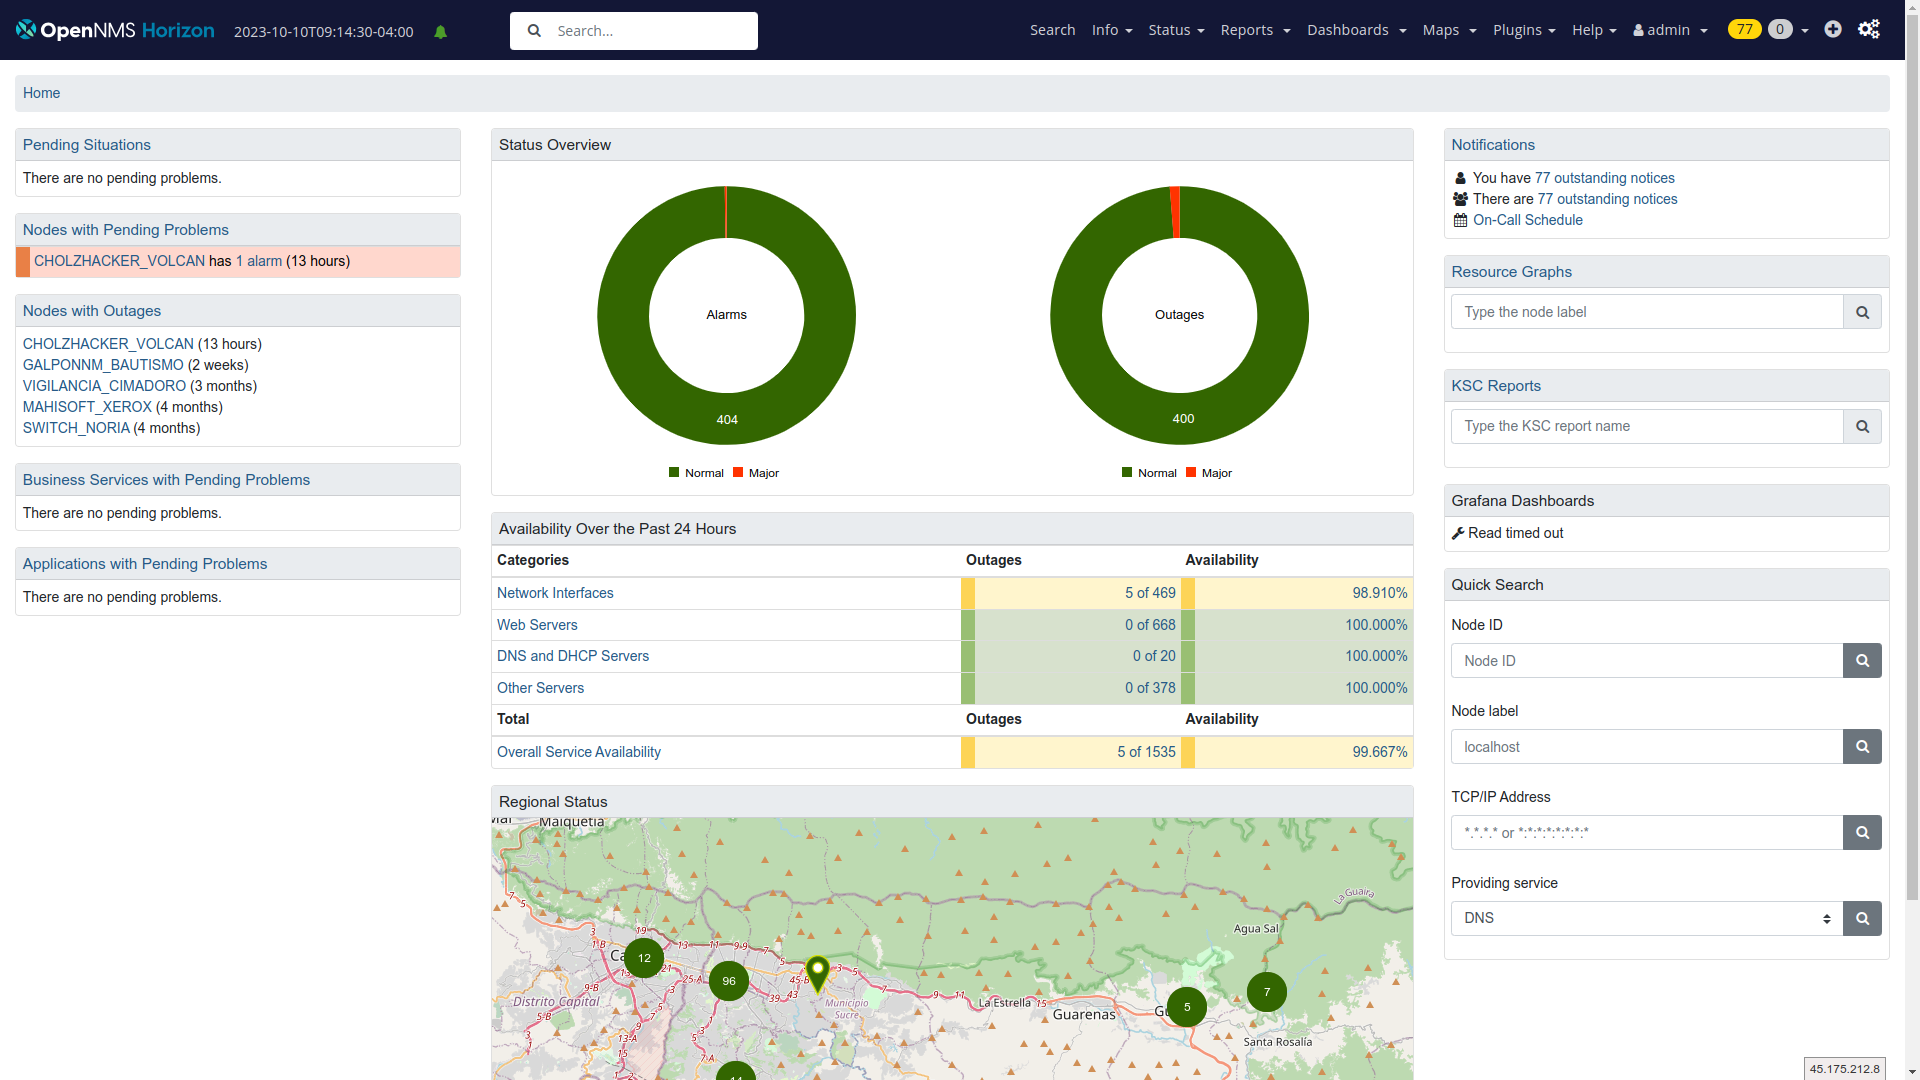
In some cases you need to weigh the possibility of acquiring an OpenNMS Meridian subscription, which is the best cost-effective solution for an enterprise-grade monitoring system—and you'll still be able to reduce costs, directly or indirectly."

Can you measure any improvements in productivity or time savings?

"Using OpenNMS has made our business more efficient by helping us track network performance quickly and accurately. OpenNMS can instantly gather information from every part of a network, ensuring that each part is performing its function. This helps us to identify and resolve issues before they cause downtime, which in turn increases productivity and less support tickets to solve ;-) …

One of the major advantages of using OpenNMS is that it gives us the ability to identify issues before our customers do. This allows us to take proactive measures to resolve the issues, which helps to improve customer satisfaction.

As a result of using OpenNMS, Urbalink Networks has built a very stable customer base without the need of aggressive marketing. We have a reputation for excellent customer service and reliability, which has helped us to increase our customer satisfaction, reduce our costs, and improve our profitability."

alt

Monitoring the regional status of Urbalink Network's network

What are you looking forward to for the future of OpenNMS?

"One of the things I look forward to is the continued growth of the OpenNMS community. I am excited to see the community continue to grow and to see what new and innovative things they come up with.

I am also excited to see how OpenNMS Horizon evolves and how it becomes more accessible to a wider range of users. In this regard, I think that the learning curve could be improved by making the interface more intuitive and by providing more wizards and other tools to help new users get started."

alt

What is your advice to others who might be considering OpenNMS?

"My humble advice to anyone considering using OpenNMS would be:

  • Get involved in the community: Getting involved in the community is a great way to learn more about OpenNMS and to get help from other users.
  • Start small: OpenNMS can be a complex platform. It is a good idea to start small and to gradually enable features and functionalities as you need them.
  • Be patient: Learning OpenNMS takes time. Be stubborn, don't give up, and don't be discouraged if you don't understand everything right away. Just keep learning and experimenting, and you will eventually get the hang of it."

Learn more

Special thanks to Jesus Palacio for his time and insight—as well as his support for OpenNMS over the past two decades.

Learn more about OpenNMS Horizon and OpenNMS Meridian, our supported enterprise network monitoring platform.

The post An Interview with Horizon User, Jesus Palacio: Part 2 appeared first on The OpenNMS Group, Inc..

by Colby Hoke at October 24, 2023 01:00 PM

October 17, 2023

An Interview with OpenNMS Horizon User, Jesus Palacio: Part 1

We're highlighting Jesus Palacio, CTO of Urbalink Networks, and an OpenNMS Horizon user for more than 20 years.

In the first part of our interview, we'll get to know Jesus, how he got started with OpenNMS, and why he's stayed with the network monitoring platform after all these years.

How did you first get started with OpenNMS?

"I first interacted with OpenNMS in 2003, when I was a network analyst at my first job after college. My boss, who was very involved in open-source initiatives, introduced me to the project. He had implemented OpenNMS as an alternative to HP OpenView. The company we worked for at the time was a value-added provider to cellular carriers, both domestic and international. We had very strict SLAs with our customers, so one of our main tasks was to ensure compliance with those SLAs. OpenNMS was a perfect fit for our needs because it enabled us to do early warning and comprehensive monitoring, which were key aspects of our roles.

Later on, my then-boss and I became business partners. We offered a wide range of technology solutions together and founded a company called Codexware (2007-2010). Unfortunately, the company is no longer in business as we moved on to different projects."

Jesus Palacio of Urbalink Networks standing

Jesus Palacio of Urbalink Networks

Can you give us a few examples of the type of companies you've collaborated with and instances where you assisted in deploying Horizon?

"I proudly remember two deployments of OpenNMS during my time as an open source solutions provider for Codexware from 2007 to 2010:

  • Eleval: In this project OpenNMS was used to monitor the performance and early warning of a wireless microwave network that was used to monitor a complex electrical power grid serving Valencia city in Carabobo state, Venezuela.
  • Genesis Telecom: This was one of the first Internet service providers (ISPs) oriented to business clients in Venezuela. At the time, their network was completely wireless and composed of a diverse range of technologies, each with its own monitoring solution. This made it difficult for their NOC (network operations center) personnel to troubleshoot and resolve problems.

We offered them OpenNMS because its agentless monitoring concept was a perfect fit for their needs. OpenNMS was able to unify the monitoring process into a single, comprehensive solution, which made it much easier for the NOC personnel to track and manage their network."

You mentioned that Codexware is no longer in business. What are you doing now?

"I’m the Chief Technology Officer of Urbalink Networks, but—beyond the title of the position—I am responsible of the technology strategy and execution of the organization.

As part of my job, I also:

  • Oversee the development and implementation of new technologies, as well as the maintenance and security of existing network infrastructure.
  • Ensure network performance and availability as our goal is to deliver reliable and high-quality services to our customers.
  • Manage the IT & Customer Support Team who are stationed in the network operations center (NOC), with the help of team leaders. This includes hiring and training new staff, as well as setting performance goals and managing the team's budget.
  • Oversee compliance with legal regulations and working with the marketing team to develop new products and services is a integral part of my position."
alt

Jesus Palacio at his desk with OpenNMS Horizon

Can you tell us more about Urbalink Networks?

"Urbalink Networks is a Venezuelan company that provides internet access, network solutions, specialized on the business segment. Through the years we have built a strong track record of providing reliable and secure services to our customers. We have a team of experienced professionals who are dedicated to providing solutions that meet the specific needs of our clients. Urbalink Networks now operates a hybrid network of fiber optic and high capacity wireless links servicing over 400 locations.

In addition, we offer the following services to our clients:

  • Network solutions: We specialize in designing, deploying, and managing networks and Wi-Fi managed access.
  • Consultancy: We offer help designing and implementing telecommunications solutions. This is a great option for businesses that are not sure where to start.

Most of the companies we help are looking for ways to reduce the cost of their monitoring solution without having to give up the possibility of customizing according to their needs. In general, we are able to work anywhere in which solutions that are tailored to fit any customer’s unique requirements are needed."

alt

What do you love about your job?

"One of the things I love about my position as CTO of Urbalink Networks is the bird's-eye view of the entire organization and the ability to help shape its future. I get to make decisions that will impact the company's success, I get to see the fruits of my labor as the company grows and evolves.

The technology industry is constantly changing, so I need to be a lifelong learner. I try my best to stay up-to-date on the latest trends and technologies, and I like to apply my knowledge to solve real-world problems. Urbalink Networks is the perfect place for this because I have the opportunity to make a real difference in the world. Our products and services are used by people every day, and we help businesses succeed.

Of course, there are also challenges. Some days can be demanding and stressful, and you need to be able to handle a lot of responsibility. However, I believe that the rewards of this role far outweigh the challenges."

What's kept you engaged with OpenNMS after all these years?

"First, I am a strong believer in the DIY (do it yourself) philosophy and open source software aligns well with that. Being able to modify and adapt a product to my needs, if I have the capacity to do so, is an amazing benefit. Additionally, OpenNMS has a large and active community of users and developers who are always willing to help, so I am never alone or helpless.

I have been able to implement and adapt OpenNMS to meet our own needs and those of our clients who've requested a network monitoring solution. No matter what type of network or devices need to be monitored, OpenNMS has always been a perfect fit. That's why I implemented OpenNMS for Urbalink when I got the position in 2009. To this day, OpenNMS is a foundational part of my daily work.

OpenNMS aligns with my values of open collaboration and sharing of knowledge. I believe that open source software will play an important role is the future of software development, and I am excited to be a part of the OpenNMS community and of course to give back. OpenNMS also has a clear mission and vision to "be the leading open source network management platform in the world." This aligns with my own goals of using the best technology available and evolving with it. I believe that OpenNMS is well-positioned to achieve this goal, and I am excited to be a part of the journey."

Part 2, coming October 24

In the next part of our interview, we'll learn more about how Jesus chose OpenNMS and the benefits he's seen from implementing the network monitoring solution for clients—as well as Urbalink Networks.

In the meantime, you can learn more about OpenNMS Horizon and Meridian.

The post An Interview with OpenNMS Horizon User, Jesus Palacio: Part 1 appeared first on The OpenNMS Group, Inc..

by Colby Hoke at October 17, 2023 01:00 PM

October 11, 2023

October 2023 Releases – Horizon 32.0.4, 2023.1.8, 2022.1.21, 2021.1.32, 2020.1.40

In October, we released updates to all OpenNMS Meridian versions under active support, as well as Horizon 32.0.4.

Meridian Stable Updates

Meridians 2023.1.8, 2022.1.21, 2021.1.32, 2020.1.40 contains documentation updates as well as a number of bug fixes and enhancements including Sentinel fixes, improvements to running in containers, and some other small changes.

For a list of changes, see the release notes:

Horizon 32.0.4

Release 32.0.4 contains documentation updates as well as a number of bug fixes and enhancements including Sentinel fixes, improvements to running in containers, metadata support improvements, and some other small changes.

For a high-level overview of what has changed in Horizon 32, see What’s New in OpenNMS Horizon 32.

For a complete list of changes, see the changelog.

The codename for Horizon 32.0.4 is Classic Eurovision.

The post October 2023 Releases – Horizon 32.0.4, 2023.1.8, 2022.1.21, 2021.1.32, 2020.1.40 appeared first on The OpenNMS Group, Inc..

by Morteza Ershad-Manesh at October 11, 2023 05:26 PM

OpenNMS Horizon 32.0.4 (Classic Eurovision)

Release 32.0.4

Release 32.0.4 contains documentation updates as well as a number of bug fixes and enhancements including Sentinel fixes, improvements to running in containers, metadata support improvements, and some other small changes.

The codename for Horizon 32.0.4 is Classic Eurovision.

Bug
  • login.jsp page is still visible/accessible after being authenticated by pre-authentication (Issue NMS-14078)
  • Fix Event documentation formatting (Issue NMS-15603)
  • Sentinel depends on unpackaged /opt/sentinel/etc/datacollection-config.xml (Issue NMS-15695)
  • Container ignores environment variable OPENNMS_DATABASE_CONNECTION_MINPOOL or confd opennms/database/connection/minpool configuration (Issue NMS-16141)
  • Postgres error when creating a database from source database template1 (Issue NMS-16143)
  • Container’s java binary is missing cap_net_raw capability (Issue NMS-16145)
  • SENTINEL_HOME points to wrong location in fix-permissions (Issue NMS-16159)
  • Update Core confd database with new schema (Issue NMS-16163)
Enhancement
  • Basic BMP Setup (Issue NMS-13893)
  • BMP set up with Minion (Issue NMS-13894)
  • BMP Setup with Sentinel (Issue NMS-13895)
  • Quick install script for first time evaluator and training (Issue NMS-14811)
  • Expand flow thresholding documentation (Issue NMS-15276)
  • Add link to configure SNMP Community strings from node admin page (Issue NMS-15772)
  • Make pool size configurable per data source. (Issue NMS-16051)
  • Monitored Service Rest API Updates for OPG (Issue NMS-16160)
  • opennms-js updates for Monitored Services for OPG (Issue NMS-16161)
  • Metadata DSL: Add effective values of service parameters in Karaf poll command (Issue NMS-16119)
  • Add language to docs for how to find schema to Kafka Producer (Issue NMS-16133)
  • Remove availability monitor content from documentation (Issue NMS-16135)
  • Migrate Tl1 docs from wiki (Issue NMS-16150)

by mershad-manesh at October 11, 2023 04:45 PM

October 10, 2023

OpenNMS.js v2.5.8

Just a minor update with some dep updates and a few small enhancements.

  • many dependency updates
  • moved from tslint to eslint
  • added fields to the monitored service object:
    • ipInterfaceId
    • ipAddress
    • nodeId
    • nodeLabel

Full Changelog

  • build(deps-dev): bump @commitlint/config-conventional from 17.6.3 to 17.6.5 by @dependabot in #606
  • build(deps-dev): bump typedoc from 0.24.7 to 0.24.8 by @dependabot in #614
  • build(deps): bump core-js from 3.30.2 to 3.31.0 by @dependabot in #626
  • build(deps-dev): bump @babel/plugin-transform-runtime from 7.22.4 to 7.22.5 by @dependabot in #624
  • build(deps): bump @babel/runtime-corejs3 from 7.22.3 to 7.22.5 by @dependabot in #627
  • build(deps-dev): bump @babel/preset-env from 7.22.4 to 7.22.5 by @dependabot in #625
  • build(deps-dev): bump webpack from 5.86.0 to 5.87.0 by @dependabot in #628
  • build(deps): bump commander from 10.0.1 to 11.0.0 by @dependabot in #629
  • build(deps-dev): bump eslint from 8.42.0 to 8.43.0 by @dependabot in #630
  • build(deps-dev): bump webpack from 5.87.0 to 5.88.0 by @dependabot in #631
  • build(deps-dev): bump @commitlint/cli from 17.6.5 to 17.6.6 by @dependabot in #632
  • build(deps-dev): bump @commitlint/config-conventional from 17.6.5 to 17.6.6 by @dependabot in #633
  • build(deps-dev): bump typescript from 5.1.3 to 5.1.5 by @dependabot in #634
  • build(deps-dev): bump typescript from 5.1.5 to 5.1.6 by @dependabot in #635
  • build(deps-dev): bump webpack from 5.88.0 to 5.88.1 by @dependabot in #636
  • build(deps-dev): bump ts-jest from 29.1.0 to 29.1.1 by @dependabot in #637
  • build(deps-dev): bump eslint from 8.43.0 to 8.44.0 by @dependabot in #638
  • build(deps): bump @babel/runtime-corejs3 from 7.22.5 to 7.22.6 by @dependabot in #639
  • build(deps-dev): bump @babel/cli from 7.22.5 to 7.22.6 by @dependabot in #640
  • build(deps-dev): bump @babel/preset-env from 7.22.5 to 7.22.6 by @dependabot in #641
  • build(deps-dev): bump @babel/core from 7.22.5 to 7.22.6 by @dependabot in #642
  • build(deps-dev): bump @babel/plugin-transform-runtime from 7.22.5 to 7.22.6 by @dependabot in #643
  • build(deps-dev): bump jest from 29.5.0 to 29.6.0 by @dependabot in #644
  • build(deps-dev): bump @babel/core from 7.22.6 to 7.22.8 by @dependabot in #646
  • build(deps-dev): bump @babel/plugin-transform-runtime from 7.22.6 to 7.22.7 by @dependabot in #645
  • build(deps-dev): bump jest from 29.6.0 to 29.6.1 by @dependabot in #649
  • build(deps-dev): bump @babel/preset-env from 7.22.6 to 7.22.7 by @dependabot in #648
  • build(deps): bump core-js from 3.31.0 to 3.31.1 by @dependabot in #647
  • build(deps-dev): bump babel-loader from 9.1.2 to 9.1.3 by @dependabot in #650
  • build(deps-dev): bump @types/jest from 29.5.2 to 29.5.3 by @dependabot in #651
  • build(deps-dev): bump @babel/preset-env from 7.22.7 to 7.22.9 by @dependabot in #652
  • build(deps-dev): bump @babel/plugin-transform-runtime from 7.22.7 to 7.22.9 by @dependabot in #653
  • build(deps): bump @xmldom/xmldom from 0.8.8 to 0.8.9 by @dependabot in #654
  • build(deps-dev): bump @babel/cli from 7.22.6 to 7.22.9 by @dependabot in #655
  • build(deps-dev): bump @babel/core from 7.22.8 to 7.22.9 by @dependabot in #656
  • build(deps-dev): bump eslint from 8.44.0 to 8.45.0 by @dependabot in #657
  • build(deps-dev): bump webpack from 5.88.1 to 5.88.2 by @dependabot in #658
  • build(deps-dev): bump @commitlint/config-conventional from 17.6.6 to 17.6.7 by @dependabot in #659
  • build(deps-dev): bump @commitlint/cli from 17.6.6 to 17.6.7 by @dependabot in #660
  • build(deps): bump @xmldom/xmldom from 0.8.9 to 0.8.10 by @dependabot in #661
  • build(deps-dev): bump jest from 29.6.1 to 29.6.2 by @dependabot in #662
  • build(deps): bump core-js from 3.31.1 to 3.32.0 by @dependabot in #663
  • build(deps-dev): bump eslint from 8.45.0 to 8.46.0 by @dependabot in #664
  • build(deps-dev): bump @babel/preset-env from 7.22.9 to 7.22.10 by @dependabot in #665
  • build(deps-dev): bump @babel/core from 7.22.9 to 7.22.10 by @dependabot in #667
  • build(deps-dev): bump @babel/cli from 7.22.9 to 7.22.10 by @dependabot in #668
  • build(deps-dev): bump @babel/plugin-transform-runtime from 7.22.9 to 7.22.10 by @dependabot in #669
  • build(deps): bump @babel/runtime-corejs3 from 7.22.6 to 7.22.10 by @dependabot in #666
  • build(deps-dev): bump @commitlint/cli from 17.6.7 to 17.7.1 by @dependabot in #672
  • build(deps-dev): bump @commitlint/config-conventional from 17.6.7 to 17.7.0 by @dependabot in #671
  • build(deps-dev): bump @types/object-hash from 3.0.2 to 3.0.3 by @dependabot in #673
  • build(deps-dev): bump eslint from 8.46.0 to 8.47.0 by @dependabot in #674
  • OPG-410: Add 'down' field to MonitoredService by @synqotik in #675
  • build(deps): bump core-js from 3.32.0 to 3.32.1 by @dependabot in #676
  • build(deps-dev): bump jest from 29.6.2 to 29.6.3 by @dependabot in #677
  • build(deps-dev): bump @types/jest from 29.5.3 to 29.5.4 by @dependabot in #678
  • build(deps): bump @babel/runtime-corejs3 from 7.22.10 to 7.22.11 by @dependabot in #680
  • build(deps-dev): bump chai from 4.3.7 to 4.3.8 by @dependabot in #679
  • build(deps-dev): bump @babel/preset-typescript from 7.22.5 to 7.22.11 by @dependabot in #681
  • build(deps-dev): bump jest from 29.6.3 to 29.6.4 by @dependabot in #682
  • build(deps-dev): bump @babel/core from 7.22.10 to 7.22.11 by @dependabot in #683
  • build(deps-dev): bump typescript from 5.1.6 to 5.2.2 by @dependabot in #684
  • build(deps-dev): bump standard-changelog from 3.0.0 to 4.0.0 by @dependabot in #687
  • build(deps): bump axios from 1.4.0 to 1.5.0 by @dependabot in #688
  • build(deps-dev): bump typedoc from 0.24.8 to 0.25.0 by @dependabot in #686
  • build(deps-dev): bump eslint from 8.47.0 to 8.48.0 by @dependabot in #685
  • convert from chalk to picocolors by @RangerRick in #689
  • build(deps-dev): bump @babel/preset-env from 7.22.10 to 7.22.14 by @dependabot in #690
  • build(deps-dev): bump @types/urijs from 1.19.19 to 1.19.20 by @dependabot in #691
  • build(deps-dev): bump @babel/plugin-transform-runtime from 7.22.10 to 7.22.15 by @dependabot in #692
  • build(deps): bump @babel/runtime-corejs3 from 7.22.11 to 7.22.15 by @dependabot in #693
  • build(deps-dev): bump @babel/preset-env from 7.22.14 to 7.22.15 by @dependabot in #694
  • build(deps-dev): bump @babel/core from 7.22.11 to 7.22.15 by @dependabot in #695
  • build(deps-dev): bump @babel/preset-typescript from 7.22.11 to 7.22.15 by @dependabot in #696
  • build(deps-dev): bump @babel/cli from 7.22.10 to 7.22.15 by @dependabot in #697
  • build(deps-dev): bump typedoc from 0.25.0 to 0.25.1 by @dependabot in #698
  • build(deps-dev): bump @types/object-hash from 3.0.3 to 3.0.4 by @dependabot in #699
  • build(deps): bump core-js from 3.32.1 to 3.32.2 by @dependabot in #700
  • build(deps-dev): bump @babel/core from 7.22.15 to 7.22.17 by @dependabot in #701
  • build(deps-dev): bump @typescript-eslint/parser from 6.6.0 to 6.7.0 by @dependabot in #704
  • build(deps-dev): bump jest from 29.6.4 to 29.7.0 by @dependabot in #705
  • build(deps-dev): bump @typescript-eslint/eslint-plugin from 6.6.0 to 6.7.0 by @dependabot in #706
  • build(deps-dev): bump @types/jest from 29.5.4 to 29.5.5 by @dependabot in #708
  • build(deps-dev): bump @babel/preset-env from 7.22.15 to 7.22.20 by @dependabot in #709
  • build(deps-dev): bump @babel/core from 7.22.17 to 7.23.0 by @dependabot in #713
  • build(deps-dev): bump @typescript-eslint/parser from 6.7.0 to 6.7.4 by @dependabot in #716
  • build(deps-dev): bump @typescript-eslint/eslint-plugin from 6.7.0 to 6.7.4 by @dependabot in #717
  • build(deps): bump axios from 1.5.0 to 1.5.1 by @dependabot in #718
  • NMS-16161: Add fields to Monitored Services by @synqotik in #723
  • build(deps): bump @babel/runtime-corejs3 from 7.22.15 to 7.23.1 by @dependabot in #719
  • build(deps-dev): bump @babel/preset-typescript from 7.22.15 to 7.23.0 by @dependabot in #721
  • build(deps-dev): bump chai from 4.3.8 to 4.3.10 by @dependabot in #722
  • build(deps-dev): bump typedoc from 0.25.1 to 0.25.2 by @dependabot in #724
  • build(deps-dev): bump eslint from 8.49.0 to 8.51.0 by @dependabot in #725
  • build(deps-dev): bump rimraf from 5.0.1 to 5.0.5 by @dependabot in #727
  • build(deps): bump ip-address from 8.1.0 to 9.0.5 by @dependabot in #726
  • build(deps): bump core-js from 3.32.2 to 3.33.0 by @dependabot in #720

Full Changelog: v2.5.7...v2.5.8

by RangerRick at October 10, 2023 02:20 PM

October 03, 2023

Modern Integration: Event-Driven Ansible & OpenNMS

Integrating systems from two different vendors can be a challenging endeavor.

However, these challenges often present unique opportunities for problem-solving. With today's innovative tools such as Red Hat Event-Driven Ansible and OpenNMS, we now have more robust and sustainable solutions at our disposal for such issues.

I'd like to share a personal experience from my previous job where we dealt with a Network Attached Storage (NAS) system issue.

Check out this Ansible demo:

https://www.youtube.com/watch?v=aqQq5vD8-n0

Story Time

Our NAS setup featured a policy server that scrutinized every operation to prevent protected data from ending up in incorrect locations within our drive shares. This process was managed synchronously via a TCP connection initiated by the policy server. Every operation on the NAS required either approval or rejection from this server.

However, an unexpected bug brought this smooth process to a standstill when the policy server would set its TCP window size to zero. The notorious 'zero window' condition means the receiver, in this case the policy server, is no longer able to receive data. The NAS will respect this request of a zero window and stop sending operations for approval. Under normal operations, this is a good thing. A receiver like the policy server maybe temporarily overloaded unfortunately, in this case it never recovered. As the connection appeared alive from both the policy server and NAS neither end would reset it to restore the window, leading to inaccessible drive shares and subsequently halting users' work.

Finding a Fix

Resolving this issue swiftly became a critical priority. Our immediate fix involved manually resetting the connection for the policy server. We probably lost some transactions during this, but the alternative of a full stop to everything was far worse. To automate this process, we crafted several bespoke scripts. However, these were problem-specific and led to a duplication of effort. Thankfully, with the advent of modern solutions, we can now address such situations in a more efficient, reliable, and sophisticated manner.

Integrate & Automate

Red Hat Event-Driven Ansible is a fantastic tool that enables instant responses to events detected by OpenNMS. In the context of our NAS system issue, the policy server traffic remained above 1 megabit per second under normal circumstances, but when the bug appeared, the traffic plunged to less than 100 kilobits per second. OpenNMS was already collecting network interface data via SNMP from the policy server, and we could simply configure this as a low threshold event.

The amalgamation of Ansible's real-time automation and OpenNMS's comprehensive monitoring and event management capabilities provides a powerful solution for network system issues. When OpenNMS triggers an event like a traffic drop below a set threshold, this information is sent to Ansible. Ansible then springs into action, running a playbook that resets the TCP connection, validates service restoration, and sends an all-clear signal.

In conclusion, modern tools and technology have revolutionized how we address complex problems, simplifying our work and providing elegant solutions. With the power of Red Hat Event-Driven Ansible and OpenNMS at your fingertips, you're well-prepared to tackle any system issues head-on!

The post Modern Integration: Event-Driven Ansible & OpenNMS appeared first on The OpenNMS Group, Inc..

by Mike Huot at October 03, 2023 01:00 PM

September 13, 2023

September 2023 Releases – Horizon 32.0.3, 2023.1.7, 2022.1.20, 2021.1.31, 2020.1.39

In September, we released updates to all OpenNMS Meridian versions under active support, as well as Horizon 32.0.3.

Meridian Stable Updates

Meridians 2023.1.7, 2022.1.20, 2021.1.31, 2020.1.39 contains a few security fixes, as well as a couple other improvements.

For a list of changes, see the release notes:

Horizon 32.0.3

Release 32.0.3 contains a bunch of documentation updates, as well as a number of bug fixes and enhancements including improvements to the Karaf core startup, polling and node search fixes, IPv6 support in ILR, and a fix for loading the Cortex timeseries plugin.

For a high-level overview of what has changed in Horizon 32, see What’s New in OpenNMS Horizon 32.

For a complete list of changes, see the changelog.

The codename for Horizon 32.0.3 is Acid Techno.

The post September 2023 Releases – Horizon 32.0.3, 2023.1.7, 2022.1.20, 2021.1.31, 2020.1.39 appeared first on The OpenNMS Group, Inc..

by Morteza Ershad-Manesh at September 13, 2023 05:52 PM

OpenNMS Horizon 32.0.3 (Acid Techno)

Release 32.0.3

Release 32.0.3 contains a bunch of documentation updates, as well as a number of bug fixes and enhancements including improvements to the Karaf core startup, polling and node search fixes, IPv6 support in ILR, and a fix for loading the Cortex timeseries plugin.

The codename for Horizon 32.0.3 is Acid Techno.

Enhancement
  • documentation enhancement for discard-uei (Issue NMS-3552)
  • BMP Introduction (Issue NMS-13892)
  • newts set OPENNMS_CASSANDRA_DC using template (Issue NMS-16025)
  • Minion Container Documentation updates (Issue NMS-16088)
  • Update help text on import-requisition Karaf command (Issue NMS-16100)
  • Docs are missing a ValueMappingPropertyExtender example (Issue NMS-16106)
Bug
  • Intermittent error starting Telemetryd: No adapter found for class: org.opennms.netmgt.telemetry.protocols.netflow.adapter.netflow5.Netflow5Adapter (Issue NMS-15345)
  • Polling fails when rrd-status is set to true (Issue NMS-15806)
  • Provisioning policies do not apply (Issue NMS-16031)
  • Prevent Invalid Node Filter Search from revealing SQL query (Issue NMS-16057)
  • Unable to install alarm history feature on Kubernetes (Issue NMS-16070)
  • Minion and Sentinel just run with Java 1.8 - 11.x instead 11 to 17 (Issue NMS-16090)
  • Cortex-tss-plugin 2.0.1 does not work on v32 (Issue NMS-16104)
  • Update Instrumentation Log Reader to parse IPv6 addresses (Issue NMS-16114)

by mershad-manesh at September 13, 2023 05:37 PM

September 12, 2023

OpenNMS.js v2.5.7

Just a minor update with dependency changes, an update targeting Horizon 33 and Foundation 2024, and a change to internal color handling.

  • dependency updates
  • down property added to monitored service model
  • converted CLI from chalk to picocolors

by RangerRick at September 12, 2023 02:52 PM

August 09, 2023

August 2023 Releases – Horizon 32.0.2, 2023.1.6, 2022.1.19, 2021.1.30, 2020.1.38

In August, we released updates to all OpenNMS Meridian versions under active support, as well as Horizon 32.0.2.

Meridian Stable Updates

Meridians 2023.1.6, 2022.1.19, 2021.1.30, 2020.1.38 contains several important security fixes, one fix for a potential DOS vulnerability, and two general bugfixes.

For a list of changes, see the release notes:

Horizon 32.0.2

Release 32.0.2 contains several important security fixes, one fix for a potential DOS vulnerability, and a handful of general bugfixes and enhancements.

For a high-level overview of what has changed in Horizon 32, see What’s New in OpenNMS Horizon 32.

For a complete list of changes, see the changelog.

The codename for Horizon 32.0.2 is Anime Lo-fi.

The post August 2023 Releases – Horizon 32.0.2, 2023.1.6, 2022.1.19, 2021.1.30, 2020.1.38 appeared first on The OpenNMS Group, Inc..

by Morteza Ershad-Manesh at August 09, 2023 06:59 PM

OpenNMS Horizon 32.0.2 (Anime Lo-fi)

Release 32.0.2

Release 32.0.2 contains several important security fixes, one fix for a potential DOS vulnerability, and a handful of general bugfixes and enhancements.

Thanks to the following researchers for responsibly disclosing security issues in this release:

  • Moshe Appelbaum reported issue NMS-15699.
  • Jordi Morales reported issues NMS-15703, NMS-15782, and NMS-15783.
  • OSS Fuzz reported issue NMS-15877.

The codename for Horizon 32.0.2 is Anime Lo-fi.

Breaking changes
  • This release removes the "3d" variation from the JFreeChart integration, because that style has been removed upstream.
Bug
  • Document the function hiding Meta-Data values with keynames containing "password" or "secret" (Issue NMS-12808)
  • Prevent Angular evaluation of strings enclosed by two curly braces in non-Angular form-fields and output (Issue NMS-15504)
  • backport fixes from Spring Security 5.x to custom Spring Security 4.2.20.RELEASE (Issue NMS-15663)
  • XXE injection via  /rtc/post using the default rtc credentials (Issue NMS-15699)
  • ROLE_REST can be used to escalate to ROLE_ADMIN via /rest/users (Issue NMS-15703)
  • Stored XSS in multiple JSP files in opennms/opennms (Issue NMS-15782)
  • Reflected XSS in multiple JSP files in opennms/opennms (Issue NMS-15783)
  • POSTINSTALL scriptlet may fail if data/tmp/ is present but empty (Issue NMS-15809)
  • PostgreSQL shows too many clients error with a minimal setup (Issue NMS-15852)
  • java.lang.ArrayIndexOutOfBoundsException: Index 0 out of bounds for length 0 at org.opennms.netmgt.timeseries.samplewrite.MetaTagDataLoader.getNodeCriteriaFromResource(MetaTagDataLoader.java (Issue NMS-15854)
  • Kafka Producer incapable of using SSL (Issue NMS-15859)
  • Fix incorrect resource types for F5 datacollection (Issue NMS-15862)
  • Build fails due to binary file filtered resource copy (Issue NMS-15869)
  • Corrected Keystore setup instructions for minion on docker (Issue NMS-16017)
  • OpenNMS Search Bar does not retrieve nodes without foreignsource and foreignid (Issue NMS-16030)
  • Error on startup with Invalid CEN header exception (Issue NMS-16034)
Story
  • Provide option to disable Kafka Offset Provider (Issue NMS-15336)
  • Document additional details for BMP integration (Issue NMS-15853)
Enhancement
  • Improve Kafka section of message broker docs in the deployment section (Issue NMS-15632)
  • Disable BeanShell interpreter remote server mode (Issue NMS-15793)
  • Include Node metadata in Measurement API query responses even if no resource data exists (Issue NMS-15839)
  • Extend filter syntax to include isSnmpPrimary (Issue NMS-15842)
  • Add docs to describe the default RRD storage retention (Issue NMS-16033)
Task
  • Document the note to increase the maximum connection when pool size is increased (Issue NMS-16050)

by mershad-manesh at August 09, 2023 06:57 PM

August 08, 2023

Secure OpenNMS Meridian: Get started with the reference architecture

Secure your Meridian deployment

Simply deploying a monitoring solution, like OpenNMS Meridian, opens up new security challenges and implications. Fortunately, there are steps, precautions, best practices, and a guide, to help you make Meridian as secure as possible.

The OpenNMS Meridian security reference architecture presents the structural components of the monitoring solution and gives you recommendations for a more secure network monitoring implementation.

This document describes out-of-the-box components and typical use patterns for OpenNMS Meridian. Of course, your implementation may vary, but this is a great place to start—or a resource to double check that you've got your security basics under control.

From the reference architecture: A typical OpenNMS deployment

What it covers

The reference architecture describes everything from a minimal deployment of Meridian (simply Meridian Core, a PostgresSQL database, and the networked devices you with to monitor) all the way to a more advanced deployment with Kafka, visualization through Grafana, load balancers, a reverse proxy, and more.

It also addresses:

  • Roles vs. permissions vs. groups within OpenNMS
  • Authentication and authorization, including default passwords and where to change them
  • SSO integration and recommendations
  • How to secure your communications
  • Zero-trust vs. protected networks
  • Java KeyStore and TrustStore, to securely store certificates and private keys

What it doesn't cover

The reference architecture is all about securing your Meridian installation. It doesn't specifically address how to install or customize the OpenNMS software.

Thankfully, that's why you also have OpenNMS documentation to lean on. If you're just getting started with OpenNMS, that's the best place to go to learn more.

Need support or consulting?

Want to take the next step, or need a helping hand with your OpenNMS deployment or implementation?

We're here to help—contact us to get the most out of your monitoring.

The post Secure OpenNMS Meridian: Get started with the reference architecture appeared first on The OpenNMS Group, Inc..

by Colby Hoke at August 08, 2023 07:41 PM

July 12, 2023

July 2023 Releases – Horizon 32.0.1, 2023.1.5, 2022.1.18, 2021.1.29, 2020.1.37

In July, we released updates to all OpenNMS Meridian versions under active support, as well as Horizon 32.0.1.

Meridian Stable Updates

Meridians 2023.1.5, 2022.1.18, 2021.1.29, 2020.1.37 contains a bunch of bug fixes, and a couple of small enhancements.

For a list of changes, see the release notes:

Horizon 32.0.1

Release 32.0.1 includes several general bug fixes and documentation improvements.

For a high-level overview of what has changed in Horizon 32, see What’s New in OpenNMS Horizon 32.

For a complete list of changes, see the changelog.

The codename for Horizon 32.0.1 is A Cappella.

The post July 2023 Releases – Horizon 32.0.1, 2023.1.5, 2022.1.18, 2021.1.29, 2020.1.37 appeared first on The OpenNMS Group, Inc..

by Morteza Ershad-Manesh at July 12, 2023 07:45 PM